






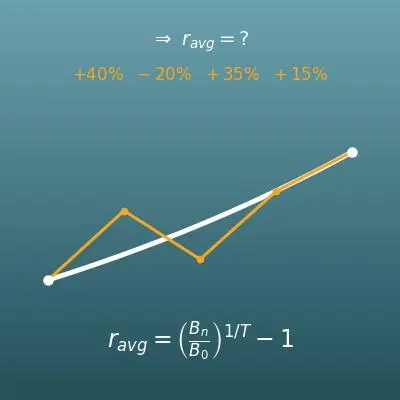










Enter the return (%) and holding period (years and months) of each period, starting with the oldest. You need at least 2 periods (up to 20). You get the cumulative return of the whole investment and the average return per year (annualized geometric average).
Table of Contents
-
What you can do on this page
-
What is this calculation used for?
-
How to Use
-
Formulas and graphs
-
Symbols and terms
-
Good to know before you start
-
How to calculate it in Excel
-
How to calculate it in Google Sheets
-
How to calculate it in Python
-
How to write it in LaTeX and other math languages (copy and paste)
-
How to have ChatGPT do the calculation
-
DataChef Features
-
Related Features
-
NumberChef Calculators List
What you can do on this page
- From the return (%) and holding period (years and months) of each period, such as "+10% for the first year, then −2% for the next 5 months…", find the cumulative return of the whole investment and the average return per year
- The average return smooths out uneven returns into "the same percentage every year that would give the same result" (the annualized geometric average). It lets you compare investments held for different lengths of time fairly
- The formula cards also explain the difference from the arithmetic mean, which can show "+25% on average" while you made nothing (the most important point on this page)
- Also shows a table of the balance at the end of each period, starting from $100,000, and a graph of the actual balance next to the curve of steady growth at the average return
What is this calculation used for?
When results are uneven, such as "+10% in year 1, −5% in year 2, +20% in year 3", the average annual returns on mutual fund and ETF fact sheets are calculated with the same geometric average as this page.
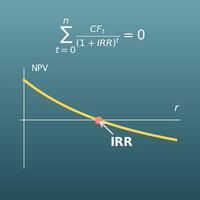
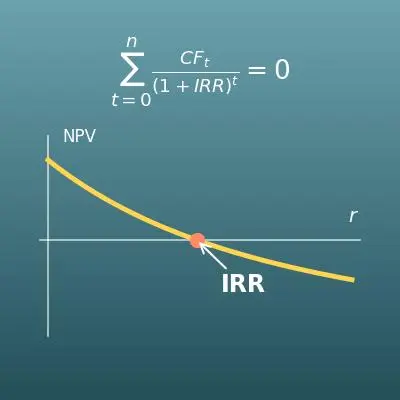
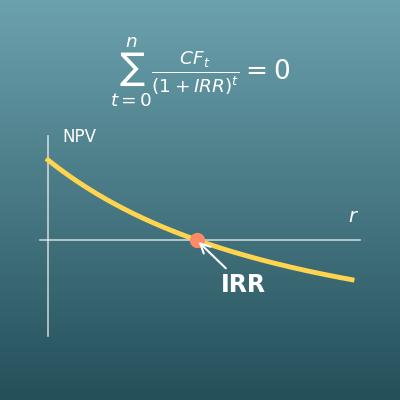
Once you can turn your own results into a yearly rate, you can compare funds with each other or check against a goal (for example, 5% a year) on the same basis. If you added or withdrew money along the way, a money-weighted return (IRR) gives the more accurate picture.
The arithmetic mean of −50% and +100% is +25%, but the actual money goes $100,000 → $50,000 → $100,000, a gain of zero. The bigger the ups and downs, the better the arithmetic mean looks compared with reality.
When you see an ad or article claiming "an average return of X%", ask whether it is an arithmetic mean or a geometric (annualized) one. This one piece of knowledge makes you much harder to fool with inflated numbers.
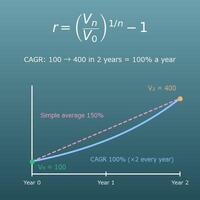
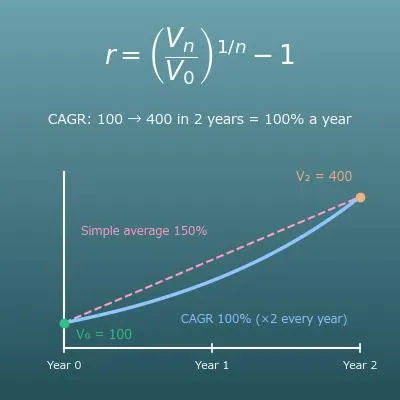
"Sales grew 1.5 times in 3 years" as a yearly rate is \(1.5^{1/3} - 1 \approx 14.5\%\). This value is called the CAGR (compound annual growth rate), and it is standard in business plans, earnings reports and investor presentations.
It lets you compare the growth of businesses or companies over different time spans on a per-year basis, so it comes up often when preparing business materials or analyzing companies.
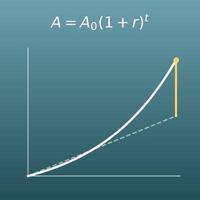
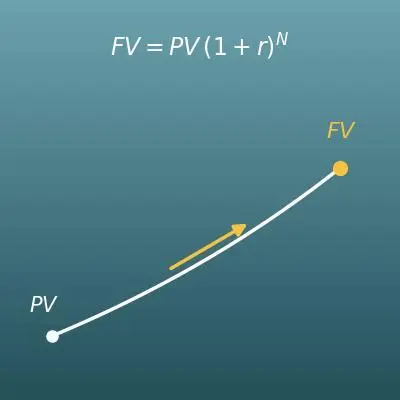
Once you know the average return per year from past results, you can estimate with compound growth how much you might have in 20 years if things continue the same way, for example in a 401(k) or an IRA (at 5% a year, money grows about 2.65 times in 20 years).
Past average returns do not guarantee the future. A sound plan also runs the numbers at a somewhat lower yearly rate and allows for a range of outcomes.
Which did better: A, with +30% over 2 years, or B, with +50% over 3.5 years? You cannot tell from the cumulative returns, but as yearly rates A is about 14.0% and B about 12.3%, so A did better.
Even if a holding period includes extra months, this page puts it on a yearly basis as is.
Formulas and graphs
Symbols and terms
Symbols
| \(r_i\) | r sub i | The return (rate of return) in period \(i\): how many percent the money grew (or shrank) in that period. In the calculation the percentage is written as a decimal (0.1 for +10%, −0.05 for −5%). |
| \(y\), \(m\) | y, m | The holding period you enter. \(y\) is the years and \(m\) is the months. (Example - for 1 year 2 months, \(y=1\) and \(m=2\)) |
| \(h_i\) | h sub i | The holding period of period \(i\) in years, found as \(h = y + m \div 12\). (Example - 1 year 2 months → about 1.17 years) |
| \(B_0\), \(B_i\), \(B_n\) | B sub 0, B sub i, B sub n | The balance. \(B_0\) is the starting amount, \(B_i\) is the balance at the end of period \(i\), and \(B_n\) is the balance at the end of the last period. The table on this page uses \(B_0 = \$100{,}000\). |
| \(T\) | T | The total holding period in years, the sum of \(h_i\) over all periods. (Example - 1 year + 1 year + 6 months → \(T = 2.5\) years) |
| \(R\) | capital R | The cumulative return, how many percent the money grew (or shrank) over the whole time. |
| \(r_{avg}\) | r sub avg | The average return per year. It turns the uneven returns of each period into "the same percentage every year", and it is the main result of this page. "avg" is short for average. |
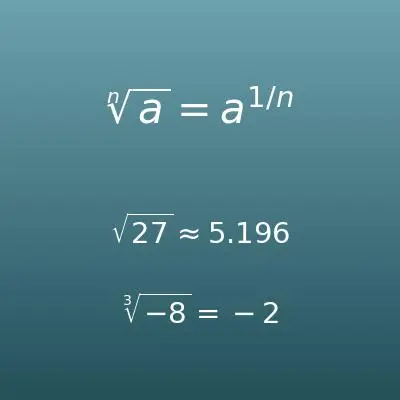
| \(x^{1/T}\) | x to the power 1 over T | The \(T\)th root of \(x\), the number that gives \(x\) when raised to the power \(T\). (Example - \(1.21^{1/2} = \sqrt{1.21} = 1.1\)) You can find it with "^(1/T)" on a scientific calculator or in Excel. |
Terms
| return (rate of return) | How many percent the invested money grew (or shrank) in a period. "Yield" is used in almost the same sense. A period with a loss has a negative return. |
| cumulative return | The total gain (or loss) over the whole time, as a percentage. It ignores how many years it took, so it is not suited to comparing investments held for different lengths of time. |
| average return | The cumulative return turned into "the same percentage every year that would give the same result" (also called the annualized return). It puts everything on a yearly basis, so it is the standard way to report investment performance. |
| geometric mean | The average of amounts linked by multiplication: multiply all \(n\) values together and take the \(n\)th root. For amounts that build up as growth factors, such as returns, the geometric mean, not the arithmetic mean, is the correct average. |
| arithmetic mean | The usual average - add everything up and divide by how many values there are. Used for returns, it looks better than reality, and more so the bigger the ups and downs (the arithmetic mean of −50% and +100% is +25%, but the actual gain is zero). |
| compounding | Adding the gains to the principal, so that in the next period the whole amount grows. The calculation on this page assumes compounding, where the balance at the end of one period becomes the principal for the next. |
| annualized | Converted to a "percent per year" basis. Results over different lengths of time, such as +3% in 6 months and +10% in 2 years, can be compared fairly once they are annualized. |
| CAGR (compound annual growth rate) | Short for compound annual growth rate. It is exactly the same calculation as the average return on this page, and it is the name commonly used for the yearly growth rate of a company's sales, number of users and so on. |
| money-weighted return | A rate of return that includes deposits and withdrawals along the way and shows how hard your own money actually worked (the same calculation as the IRR, internal rate of return). For investments with money added or taken out along the way, such as regular contributions, this is a better fit than the calculation on this page. The return on this page, which ignores those flows, is also called the time-weighted return. |
Good to know before you start
Here is what helps you use the calculation on this page with real understanding, not just by pressing the button.
| Percents (Grade 6) |
|
| Fractions and decimals (Grades 4–5) |
|
| Positive and negative numbers (Grades 6–7) |
|
| Exponents (Grade 8) |
|
| Roots and rational exponents (Algebra 2) |
|
| Compound interest (high school personal finance and math) |
|
How to calculate it in Excel
| Holding period: years | 1 |
| Holding period: months | 2 |
| Holding period in years | =B1+B2/12 |
| Previous period's ending balance ($) | 100000 |
| Return in this period (%) | 10 |
| Holding period in years | 2 |
| Ending balance ($) | =B1*(1+B2/100)^B3 |
| Starting amount ($) | 100000 |
| Final balance ($) | 132000 |
| Cumulative return (%) | =(B2/B1-1)*100 |
| Starting amount ($) | 100000 |
| Final balance ($) | 132000 |
| Total holding period (years) | 2 |
| Average return (% per year) | =((B2/B1)^(1/B3)-1)*100 |
The first table gives 1 + 2 ÷ 12, about 1.17 years, and the second gives 100,000 × 1.1 × 1.1 = $121,000.
The third table shows 32% and the fourth about 14.89%. Just replace the numbers in column B with your own.
How to calculate it in Google Sheets
| Holding period: years | 1 |
| Holding period: months | 2 |
| Holding period in years | =B1+B2/12 |
| Previous period's ending balance ($) | 100000 |
| Return in this period (%) | 10 |
| Holding period in years | 2 |
| Ending balance ($) | =B1*(1+B2/100)^B3 |
| Starting amount ($) | 100000 |
| Final balance ($) | 132000 |
| Cumulative return (%) | =(B2/B1-1)*100 |
| Starting amount ($) | 100000 |
| Final balance ($) | 132000 |
| Total holding period (years) | 2 |
| Average return (% per year) | =((B2/B1)^(1/B3)-1)*100 |
How to calculate it in Python
# (return %, years held, months held), from the oldest period to the newest
periods = [(10, 1, 2), (-2, 0, 5), (15, 2, 3)]
start_balance = 100000         # starting amount ($)

balance = start_balance
total_years = 0
for return_percent, years, months in periods:
    holding_years = years + months / 12                       # holding period in years
    total_years += holding_years
    balance *= (1 + return_percent / 100) ** holding_years    # compounding chain
    print(f"Return {return_percent}% for {holding_years:.4f} years -> balance ${balance:,.0f}")

cumulative_return = (balance / start_balance - 1) * 100
average_return = ((balance / start_balance) ** (1 / total_years) - 1) * 100
print(f"Cumulative return: {cumulative_return:.2f}%")
print(f"Average return (per year): {average_return:.2f}%")
print(f"Total holding period: {total_years:.4f} years")
How to write it in LaTeX and other math languages (copy and paste)
h = y + m ÷ 12
h = y + \dfrac{m}{12}
<math xmlns="http://www.w3.org/1998/Math/MathML" display="block">
  <mrow>
    <mi>h</mi>
    <mo>=</mo>
    <mi>y</mi>
    <mo>+</mo>
    <mfrac>
      <mi>m</mi>
      <mn>12</mn>
    </mfrac>
  </mrow>
</math>
h = y + m / 12
y + m/12
h := y + m/12;
h = y + m/12;
h = y + m/12
B_i = B_{i-1} \times (1 + r_i)^{h_i}
<math xmlns="http://www.w3.org/1998/Math/MathML" display="block">
<mrow>
<msub><mi>B</mi><mi>i</mi></msub>
<mo>=</mo>
<msub><mi>B</mi><mrow><mi>i</mi><mo>−</mo><mn>1</mn></mrow></msub>
<mo>×</mo>
<msup>
<mrow><mo>(</mo><mn>1</mn><mo>+</mo><msub><mi>r</mi><mi>i</mi></msub><mo>)</mo></mrow>
<msub><mi>h</mi><mi>i</mi></msub>
</msup>
</mrow>
</math>
B_i = B_(i-1) (1 + r_i)^(h_i)
bprev (1 + r)^h
B := Bprev*(1 + r)^h;
B = Bprev*(1 + r)^h;
B_i = B_(i−1) (1 + r_i)^(h_i)
R = Bₙ ÷ B₀ − 1
R = \dfrac{B_n}{B_0} - 1
<math xmlns="http://www.w3.org/1998/Math/MathML" display="block">
<mrow>
<mi>R</mi>
<mo>=</mo>
<mfrac>
<msub><mi>B</mi><mi>n</mi></msub>
<msub><mi>B</mi><mn>0</mn></msub>
</mfrac>
<mo>−</mo>
<mn>1</mn>
</mrow>
</math>
R = (B_n) / (B_0) - 1
bn/b0 - 1
R := Bn/B0 - 1;
R = Bn/B0 - 1;
R = B_n/B_0 − 1
r_{avg} = \left(\dfrac{B_n}{B_0}\right)^{1/T} - 1
<math xmlns="http://www.w3.org/1998/Math/MathML" display="block">
<mrow>
<msub><mi>r</mi><mi>avg</mi></msub>
<mo>=</mo>
<msup>
<mrow>
<mo>(</mo>
<mfrac>
<msub><mi>B</mi><mi>n</mi></msub>
<msub><mi>B</mi><mn>0</mn></msub>
</mfrac>
<mo>)</mo>
</mrow>
<mrow><mn>1</mn><mo>/</mo><mi>T</mi></mrow>
</msup>
<mo>−</mo>
<mn>1</mn>
</mrow>
</math>
r_(avg) = ((B_n) / (B_0))^(1/T) - 1
(bn/b0)^(1/T) - 1
r_avg := (Bn/B0)^(1/T) - 1;
r_avg = (Bn/B0)^(1/T) - 1;
r_avg = (B_n/B_0)^(1/T) − 1
How to have ChatGPT do the calculation
You are an investment calculation assistant. Do the following calculation by actually running Python code, and base your answer only on the numbers from the execution result (do not answer by mental math or guessing).

An investment had these results, from the oldest period to the newest:
- A return of +10% for 1 year 2 months
- A return of −2% for 5 months
- A return of +15% for 2 years 3 months
Convert each holding period to years as "years + months ÷ 12", and link the balances by compounding (the balance at the end of one period is the principal for the next).
Find each of the following:
1. The cumulative return (%, 2 decimal places) = growth factor for the whole time − 1
2. The average return (% per year, 2 decimal places) = growth factor for the whole time to the power (1 / total holding period) − 1 (geometric average)
3. The total holding period (years)
4. The balance at the end of each period, starting from $100,000 ($)

Show the formulas you used and the numbers from the execution result.
How to Use
-
1Enter your numbersType the numbers you want to calculate with into the input fields
-
2CalculatePress the "Calculate" button
-
3Check the resultThe result appears on the spot. The same page also explains the idea behind the calculation and the formula
DataChef Features

No technical knowledge required.
Intuitive and user-friendly operation.

Can be used without registering personal information.

Automatic file deletion by clicking "download".

and rapid file conversion.

No attribution required.

No need to contact us for commercial use permission.
Related Features
IRR Calculator (Internal Rate of Return from Cash Flows)
Finds the rate of return from an initial investment and yearly cash flows. Better suited to investments with deposits or withdrawals along the way
ROI Calculator (Return on Investment and Annualized ROI)
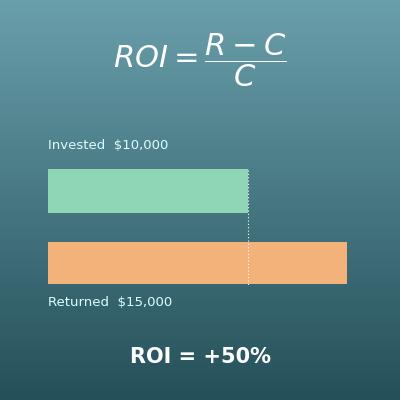
Finds ROI and annualized ROI from the amount invested and the amount returned. Easier when all you know is how much went in and how much came back
Compound Interest Calculator (Final Amount and Rate Conversion)
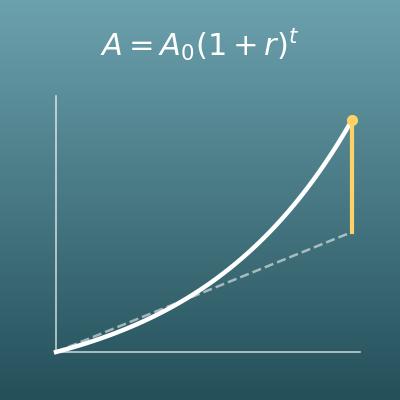
Compounding is the basis of the average return. Finds how much your principal grows to at a fixed rate
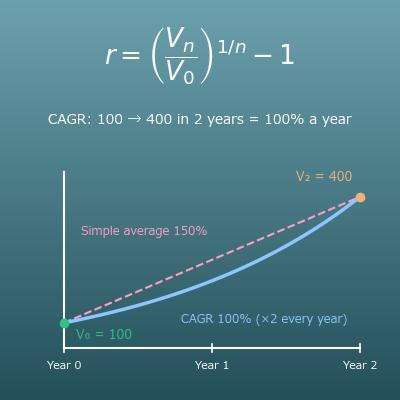
CAGR Calculator (Compound Annual Growth Rate, Solve for Any Value)
For the yearly growth rate (CAGR) of sales, users and so on when you only know the starting and ending values. It can also work out the years needed to reach a goal