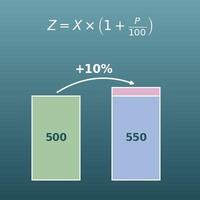



Enter the three values you know out of starting value, ending value, period and CAGR (%), leave the one you want to find blank and press "Calculate". The blank value is worked out, and a year-by-year table and a growth curve are shown.
Table of Contents
-
What you can do on this page
-
What is this calculation used for?
-
How to Use
-
Formulas and graphs
-
Symbols and terms
-
Good to know before you start
-
How to calculate it in Excel
-
How to calculate it in Google Sheets
-
How to calculate it in Python
-
How to write it in LaTeX and other math languages (copy and paste)
-
How to have ChatGPT do the calculation
-
DataChef Features
-
Related Features
-
NumberChef Calculators List
What you can do on this page
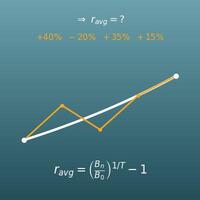
- From a starting value, an ending value and the number of years, find the compound annual growth rate (CAGR). For example, "sales grew from $1 million to $1.61 million in 5 years" is about 10% growth a year. CAGR turns uneven growth into "the same percent every year" that would give the same result
- Enter any three of the four fields (starting value, ending value, years, CAGR) and the fourth is worked out. "How many years to double sales at 10% growth a year?" (years), "What will it be in 5 years at 15% a year?" (ending value) and "How big do we need to be now to hit the target?" (starting value) all work
- Enter the period as years, including decimals such as 2.5, or as months, such as 18. The years to reach a target are shown both as a decimal and rounded up (the year in which you reach it)
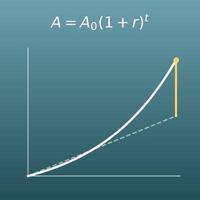
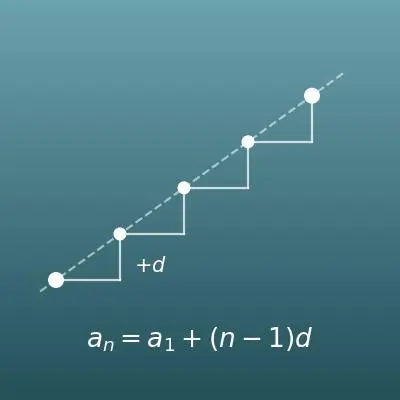
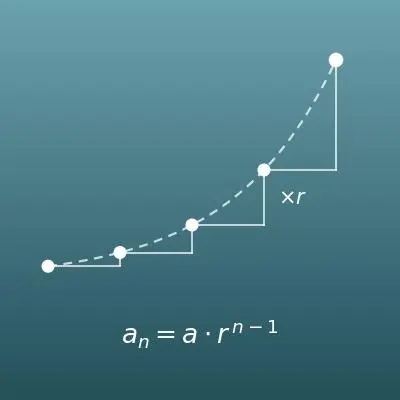
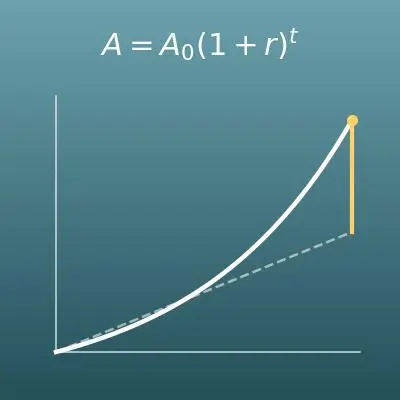
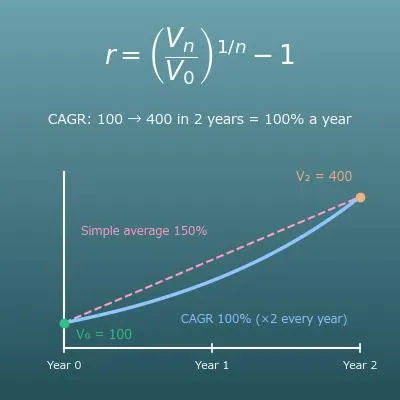
- A year-by-year table and a graph that lays the growth curve (starting value × (1 + CAGR) to the power of the years) over the straight line for "the same amount every year" show the difference from the simple average growth rate at a glance
What is this calculation used for?
Startup business plans and public companies' earnings presentations describe the growth of sales or users as, for example, "a 3-year CAGR of 25%". If sales grew from $2 million to $3.9 million in 3 years, the CAGR is \((3.9 \div 2)^{1/3} - 1 \approx 0.249\), or about 25%.
Even when growth is uneven from year to year, one number shows how fast something grew, so you can compare companies of different sizes over different periods. But CAGR looks only at two points, so it hides what happened in between, such as a jump in the last year only. When reading a report, check the year-by-year figures too.
To the question "if we keep growing 10% a year, when will sales double?", the years formula answers \(\log 2 \div \log 1.1 \approx 7.27\) years, so sales pass double by the end of year 8. The other way around, if the goal is to double in 5 years, the CAGR needed is \(2^{1/5} - 1 \approx 0.149\), or growth of about 14.9% a year.
Once "how many percent a year gets us to the goal" is a number, you can break it down into a sales target for each year (the year-by-year table).
If an app's monthly users grew from 50,000 to 200,000 (4 times) in 2 years, the CAGR is \(4^{1/2} - 1 = 1\): 100% a year (doubling every year). If another app grew 4 times in 4 years, it is \(4^{1/4} - 1 \approx 0.414\), about 41% a year. The same "4 times" grew at very different speeds, and CAGR makes that visible.
The same formula works as is for things not measured in dollars, like numbers of users.
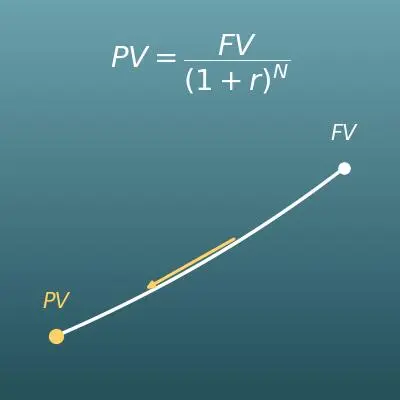
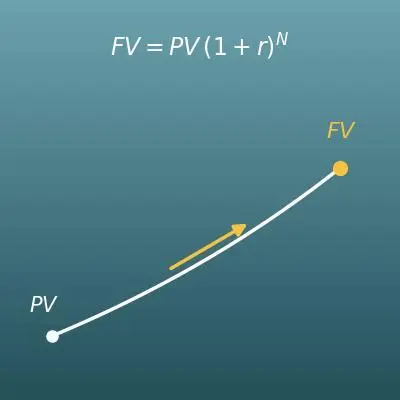
If a market is expected to grow 8% a year on average, a market worth $1 billion today can be estimated at \(1 \times 1.08^5 \approx 1.469\), or about $1.47 billion, in 5 years (the ending value formula). Many "market size in X years" figures in industry reports are built with this kind of calculation.
Keep in mind that the number assumes the growth rate stays the same from now on. Check the assumptions of the forecast (what percent, for how many years) before you use it.
If a town's population fell from 50,000 to 40,000 in 10 years, the CAGR is \((4 \div 5)^{1/10} - 1 \approx -0.0221\), a decline of about 2.2% a year. Simply dividing "20% down in 10 years" into "2% down a year" is a little off, because decline also compounds (each year's drop is measured from the population after the last drop).
A decline uses exactly the same formula; the CAGR is just negative. With the years formula, you can also work back to how many years until the population falls below 30,000 if the same pace continues.
For example, if someone earned $40,000 a year 20 years ago and earns $60,000 now, the CAGR is \((60 \div 40)^{1/20} - 1 \approx 0.0205\), growth of about 2% a year. The rise in prices (inflation) can also be turned into an average yearly percent with the same formula, so you can compare the growth of your pay and of prices with the same yardstick.
Turning a long-term change into a yearly rate is what CAGR does best. "50% more in 20 years" sounds big, but as a yearly rate it is about 2%, a number you can relate to.
Formulas and graphs
Symbols and terms
Symbols
| CAGR | C-A-G-R, or "kay-ger" | Compound annual growth rate - the percent per year if growth stayed the same every year. On this page it is written with the symbol \(r\). |
| \(V_0\) | V sub zero | The starting value (the value at the start of the period). \(V\) stands for value, and the small 0 at the lower right stands for year 0. (Example - sales of $1,000,000 five years ago) |
| \(V_n\) | V sub n | The ending value (the value after \(n\) years). The small \(n\) at the lower right stands for year \(n\). (Example - sales of $1,610,510 this year) |
| \(G\) | G | The growth multiple: ending value ÷ starting value (\(V_n \div V_0\)), how many times larger it got over the whole period. It stands for growth. (Example - $1,000,000 → $1,210,000 gives \(G = 1.21\)) |
| \(n\) | n | The number of years from the starting value to the ending value. It stands for number. It can be a decimal such as 2.5 (18 months is \(18 \div 12 = 1.5\) years). |
| \(r\) | r | The CAGR written as a decimal. It stands for rate. For 10%, \(r = 0.1\); multiply by 100 to show it as a percent. |
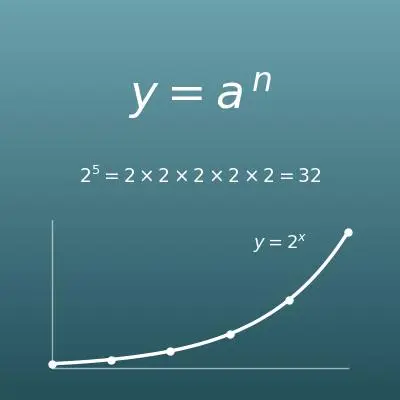
| \(1 + r\) | one plus r | The multiple per year. For 10% growth, it is \(1 + 0.1 = 1.1\). It is the original 1 plus the growth \(r\), and over \(n\) years it multiplies to \((1 + r)^n\). |
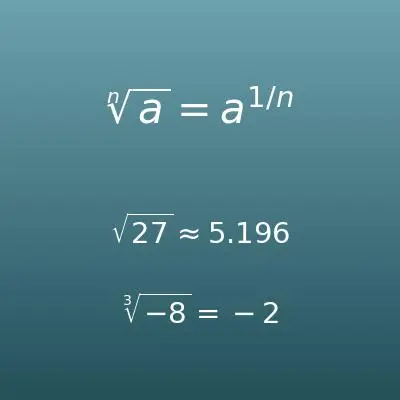
| \(x^{1/n}\) | x to the one over n | \(x\) to the \(1/n\) power: the number that gives \(x\) when raised to the \(n\)th power (the \(n\)th root \(\sqrt[n]{x}\)). For 2 years it is the square root, and for 3 years the cube root. (Example - \(1.21^{1/2} = \sqrt{1.21} = 1.1\)) |
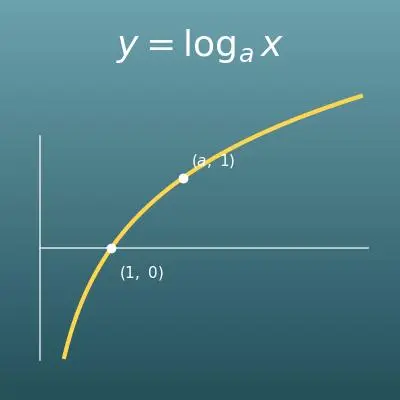
| \(\log\) | log | Logarithm: the symbol for "to what power must a number be raised to get this value?". This page uses it to work back to the years, as in "to what power must 1.1 be raised to get 2?". The base can be 10 (common log) or \(e\) (natural log, \(\ln\)); as long as the top and bottom use the same base, the answer is the same. |
| \(g\) | g | The simple average growth rate: just the total growth divided by the years, for reference. It has its own letter to keep it apart from the CAGR \(r\) (and it is a different quantity from the capital \(G\), the growth multiple). |
Terms
| CAGR (compound annual growth rate) | Growth over several years turned into the percent per year that, kept the same every year, gives the same result. It depends only on the starting value, the ending value and the number of years; the ups and downs in between do not enter the calculation. It is the standard measure for comparing the growth of sales, users, market size, population and so on as a yearly rate. |
| compounding | Growth where the same percent is also added to what has already been added. Two years of 10% growth give \(1.1 \times 1.1 = 1.21\) times (21% more), not "10% + 10% = 20% more". CAGR smooths growth using this compound view. |
| geometric mean | The average you get by multiplying \(n\) numbers together and taking the \(1/n\) power. CAGR is the geometric mean of the yearly multiples minus 1, which is different from the usual average (add up and divide, the arithmetic mean). For quantities linked by multiplication, like multiples, use the geometric mean. |
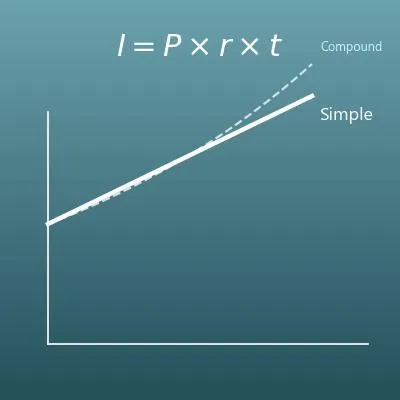
| simple average growth rate (arithmetic mean) | Just the total growth over the period divided by the number of years. It is the straight-line view, "the same amount every year", and it ignores compounding, so for growth over more than a year it comes out larger than the CAGR (for a decline, the yearly drop comes out smaller than the CAGR). When you talk about a yearly rate, CAGR is the standard. |
| growth multiple | Ending value ÷ starting value, how many times larger it got over the whole period. $1,000,000 growing to $1,610,510 is about 1.61 times. Subtract 1 and multiply by 100 to get the total growth (about 61% more). |
| nth root | The number that gives a number when raised to the \(n\)th power, written \(\sqrt[n]{x}\) or \(x^{1/n}\). If something grew 1.21 times in 2 years, the multiple per year is \(\sqrt{1.21} = 1.1\), and this is the heart of the CAGR calculation. |
| logarithm (log) | The number for the power in "to what power must \(a\) be raised to get \(b\)?", written \(\log_{a} b\). It finds an exponent (a number of times multiplied), so it is used to work back to years, as in "how many years to double at 10% growth a year?". |
| Rule of 72 | A rule of thumb for mental math - "years to double ≈ 72 ÷ yearly rate (%)". At 10% a year it takes about 7.2 years to double, and at 5% about 14.4 years. It comes very close to the exact value from logarithms. |
| year-over-year (YoY) growth | The change from last year to this year, as in "up 10% year over year". CAGR is the value this yearly change would have if it were the same every year. |
Good to know before you start
Here is what helps you use the calculation on this page with real understanding, not just by pressing the button.
If you get stuck, going back over these topics is the quickest way forward.
| Percents (Grade 6) |
|
| Exponents (Grades 6–8) |
|
| Compound interest (Algebra 1 and personal finance) |
|
| nth roots and rational exponents (Algebra 2) |
|
| Logarithms (Algebra 2 and Precalculus) |
|
| Expressions and rearranging equations (Grades 7–8) |
|
How to calculate it in Excel
| Starting value V0 | 1000 |
| Ending value Vn | 1610.51 |
| Years n | 5 |
| CAGR r (%) | =((B2/B1)^(1/B3)-1)*100 |
| Starting value V0 | 1000 |
| CAGR r (%) | 10 |
| Years n | 3 |
| Ending value Vn | =B1*(1+B2/100)^B3 |
| Ending value Vn | 1331 |
| CAGR r (%) | 10 |
| Years n | 3 |
| Starting value V0 | =B1/(1+B2/100)^B3 |
| Starting value V0 | 1000 |
| Ending value Vn (target) | 2000 |
| CAGR r (%) | 10 |
| Years n | =LN(B2/B1)/LN(1+B3/100) |
| Years rounded up | =ROUNDUP(B4,0) |
| Starting value V0 | 1000 |
| Ending value Vn | 1210 |
| Years n | 2 |
| Simple average growth rate g (%) | =(B2/B1-1)/B3*100 |
For example, the first table shows 10 in B4 (a CAGR of 10%), the second shows 1331 in B4 (the value after 3 years), the third shows 1000 in B4 (the starting value needed), the fourth shows about 7.27 in B4 (years) and 8 in B5 (years rounded up), and the fifth shows 10.5 in B4 (the simple average growth rate).
"^(1/B3)" is "to the 1/n power", and "LN" is the natural logarithm (log base \(e\)). The years formula gives the same answer with "LOG10" or "LOG", as long as the top and bottom use the same function.
CAGR can also be found with Excel's function "=RRI(years, starting value, ending value)" (in the first table, "=RRI(B3,B1,B2)*100").
How to calculate it in Google Sheets
| Starting value V0 | 1000 |
| Ending value Vn | 1610.51 |
| Years n | 5 |
| CAGR r (%) | =((B2/B1)^(1/B3)-1)*100 |
| Starting value V0 | 1000 |
| CAGR r (%) | 10 |
| Years n | 3 |
| Ending value Vn | =B1*(1+B2/100)^B3 |
| Ending value Vn | 1331 |
| CAGR r (%) | 10 |
| Years n | 3 |
| Starting value V0 | =B1/(1+B2/100)^B3 |
| Starting value V0 | 1000 |
| Ending value Vn (target) | 2000 |
| CAGR r (%) | 10 |
| Years n | =LN(B2/B1)/LN(1+B3/100) |
| Years rounded up | =ROUNDUP(B4,0) |
| Starting value V0 | 1000 |
| Ending value Vn | 1210 |
| Years n | 2 |
| Simple average growth rate g (%) | =(B2/B1-1)/B3*100 |
How to calculate it in Python
import math

start_value = 1000      # starting value (e.g., sales 5 years ago, in thousands of dollars)
end_value = 1610.51     # ending value (e.g., this year's sales)
years = 5               # years

# CAGR = (ending value / starting value)^(1/years) - 1
cagr = (end_value / start_value) ** (1 / years) - 1
print(f"CAGR: {cagr * 100:.2f}%")

# For reference: simple average growth rate = total growth / years
simple_avg = (end_value / start_value - 1) / years
print(f"Simple average growth rate: {simple_avg * 100:.2f}%")

# Working back 1: the value after n years from the starting value and CAGR
rate = 0.10             # CAGR (10%)
future_value = start_value * (1 + rate) ** 3
print(f"Value after 3 years: {future_value:.2f}")

# Working back 2: the years to reach a target from the starting value, target and CAGR
target_value = 2000
years_needed = math.log(target_value / start_value) / math.log(1 + rate)
print(f"Years to double: {years_needed:.2f} (rounded up: {math.ceil(years_needed)})")
How to write it in LaTeX and other math languages (copy and paste)
r = (Vₙ ÷ V₀)^(1/n) − 1
r = \left(\dfrac{V_n}{V_0}\right)^{1/n} - 1
<math xmlns="http://www.w3.org/1998/Math/MathML" display="block">
<mrow>
<mi>r</mi>
<mo>=</mo>
<msup>
<mrow>
<mo>(</mo>
<mfrac><msub><mi>V</mi><mi>n</mi></msub><msub><mi>V</mi><mn>0</mn></msub></mfrac>
<mo>)</mo>
</mrow>
<mrow><mn>1</mn><mo>/</mo><mi>n</mi></mrow>
</msup>
<mo>−</mo>
<mn>1</mn>
</mrow>
</math>
r = (V_n/V_0)^(1/n) - 1
(vn/v0)^(1/n) - 1
r := (V_n/V_0)^(1/n) - 1;
r = (V_n/V_0)^(1/n) - 1;
r = (V_n/V_0)^(1/n) - 1
Vₙ = V₀ × (1 + r)ⁿ
V_n = V_0 (1 + r)^{n}
<math xmlns="http://www.w3.org/1998/Math/MathML" display="block">
  <mrow>
    <msub><mi>V</mi><mi>n</mi></msub>
    <mo>=</mo>
    <msub><mi>V</mi><mn>0</mn></msub>
    <msup>
      <mrow><mo>(</mo><mn>1</mn><mo>+</mo><mi>r</mi><mo>)</mo></mrow>
      <mi>n</mi>
    </msup>
  </mrow>
</math>
V_n = V_0 (1 + r)^n
v0 (1 + r)^n
V_n := V_0*(1 + r)^n;
V_n = V_0*(1 + r)^n;
V_n = V_0 (1 + r)^n
V₀ = Vₙ ÷ (1 + r)ⁿ
V_0 = \dfrac{V_n}{(1 + r)^{n}}
<math xmlns="http://www.w3.org/1998/Math/MathML" display="block">
  <mrow>
    <msub><mi>V</mi><mn>0</mn></msub>
    <mo>=</mo>
    <mfrac>
      <msub><mi>V</mi><mi>n</mi></msub>
      <msup>
        <mrow><mo>(</mo><mn>1</mn><mo>+</mo><mi>r</mi><mo>)</mo></mrow>
        <mi>n</mi>
      </msup>
    </mfrac>
  </mrow>
</math>
V_0 = V_n/(1 + r)^n
vn/(1 + r)^n
V_0 := V_n/(1 + r)^n;
V_0 = V_n/(1 + r)^n;
V_0 = V_n/(1 + r)^n
n = log(Vₙ ÷ V₀) ÷ log(1 + r)
n = \dfrac{\log\left(V_n / V_0\right)}{\log(1 + r)}
<math xmlns="http://www.w3.org/1998/Math/MathML" display="block">
  <mrow>
    <mi>n</mi>
    <mo>=</mo>
    <mfrac>
      <mrow><mi>log</mi><mo>(</mo><msub><mi>V</mi><mi>n</mi></msub><mo>/</mo><msub><mi>V</mi><mn>0</mn></msub><mo>)</mo></mrow>
      <mrow><mi>log</mi><mo>(</mo><mn>1</mn><mo>+</mo><mi>r</mi><mo>)</mo></mrow>
    </mfrac>
  </mrow>
</math>
n = log(V_n/V_0)/log(1 + r)
Log[vn/v0]/Log[1 + r]
n := log(V_n/V_0)/log(1 + r);
n = log(V_n/V_0)/log(1 + r);
n = log(V_n/V_0)/log(1 + r)
g = (Vₙ ÷ V₀ − 1) ÷ n
g = \dfrac{V_n / V_0 - 1}{n}
<math xmlns="http://www.w3.org/1998/Math/MathML" display="block">
<mrow>
<mi>g</mi>
<mo>=</mo>
<mfrac>
<mrow><msub><mi>V</mi><mi>n</mi></msub><mo>/</mo><msub><mi>V</mi><mn>0</mn></msub><mo>−</mo><mn>1</mn></mrow>
<mi>n</mi>
</mfrac>
</mrow>
</math>
g = (V_n/V_0 - 1)/n
(vn/v0 - 1)/n
g := (V_n/V_0 - 1)/n;
g = (V_n/V_0 - 1)/n;
g = (V_n/V_0 - 1)/n
How to have ChatGPT do the calculation
You are an assistant for business planning. Do the following calculation by actually running Python code, and base your answer only on the numbers from the execution result (do not answer by mental math or guessing).

A company's annual sales were $1,000,000 five years ago and $1,610,510 this year.
Find each of the following:
1. The compound annual growth rate, CAGR ((ending value ÷ starting value)^(1/years) − 1, as a percent to 2 decimal places)
2. For reference, the simple average growth rate ((ending value ÷ starting value − 1) ÷ years, as a percent), and in 1 or 2 sentences why it differs from the CAGR
3. Sales 3 years from the start if this CAGR continues (starting value × (1 + CAGR)^3)
4. Starting from this year's sales, the years until sales double at the same CAGR (log(2) ÷ log(1 + CAGR), both as a decimal and rounded up)

Show the formulas you used and the numbers from the execution result.
How to Use
-
1Enter your numbersType the numbers you want to calculate with into the input fields
-
2CalculatePress the "Calculate" button
-
3Check the resultThe result appears on the spot. The same page also explains the idea behind the calculation and the formula
DataChef Features

No technical knowledge required.
Intuitive and user-friendly operation.

Can be used without registering personal information.

Automatic file deletion by clicking "download".

and rapid file conversion.

No attribution required.

No need to contact us for commercial use permission.
Related Features
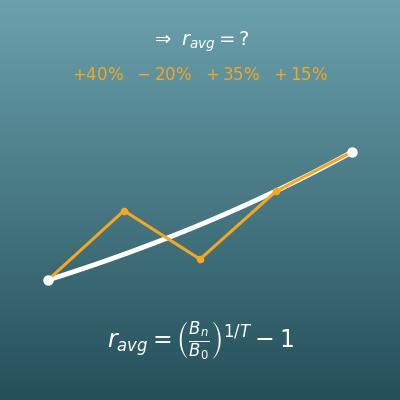
Average Return Calculator (Annualized Geometric Average and Cumulative Return)
Find the smoothed annual rate when you know each period's return (+10%, −2%, +15% ...). Use it for investments where you know the values in between
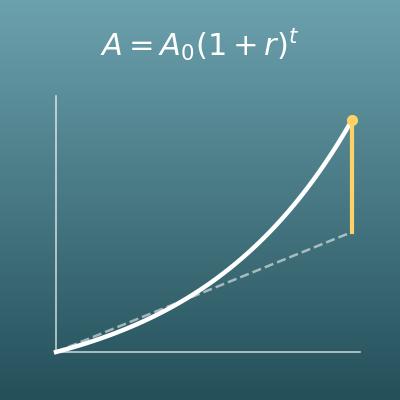
Compound Interest Calculator (Final Amount and Rate Conversion)
The compounding that CAGR is built on. Find what a principal grows to at a fixed interest rate
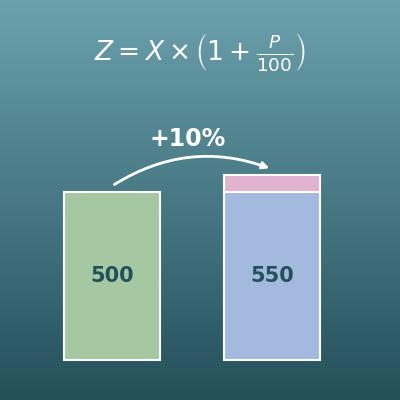
Percentage Change Calculator (Increase and Decrease)
Find a one-time percentage change, such as growth from last year. CAGR smooths this over many years