



Choose the approach (expenditure or income) and enter the amount of each part. Blank fields count as 0. Any unit works, but for US GDP, trillions of dollars is a good choice.
Table of Contents
-
What you can do on this page
-
What is this calculation used for?
-
How to Use
-
Formulas and graphs
-
Symbols and terms
-
Good to know before you start
-
How to calculate it in Excel
-
How to calculate it in Google Sheets
-
How to calculate it in Python
-
How to write it in LaTeX and other math languages (copy and paste)
-
How to have ChatGPT do the calculation
-
DataChef Features
-
Related Features
-
NumberChef Calculators List
What you can do on this page
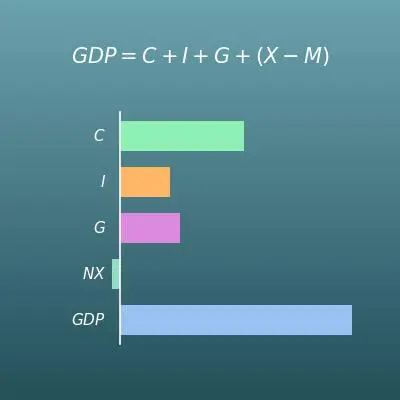
- Enter just five amounts, consumption, investment, government spending, exports and imports, to find GDP (gross domestic product) with the expenditure formula \(\mathrm{GDP} = C + I + G + (X - M)\) (the standard formula from economics class and AP Macroeconomics)
- Switch to "From income" to find GDP from compensation of employees, operating surplus and mixed income, consumption of fixed capital, and taxes less subsidies, the categories of the national accounts (the same ones the US Bureau of Economic Analysis, BEA, uses for gross domestic income)
- Net exports (exports − imports) are calculated at the same time, and a horizontal bar chart shows at a glance which parts make up GDP (negative net exports appear as a bar pointing left)
- Blank fields count as 0, so you can also quickly add up just the parts you know
- A plain-language explanation of the formulas, why the approaches give the same GDP, the difference between nominal and real GDP, and copy-and-paste formulas for Excel, Google Sheets and Python are all on this page
What is this calculation used for?
"GDP = C + I + G + (X − M)" is a formula you meet again and again, from high school economics to AP Macroeconomics and college principles courses. Questions such as "calculate GDP from the table" or "what happens to GDP when net exports are negative?" can be solved just by plugging the numbers into this formula.
Learning it together with the idea that GDP measured from production, income or spending gives the same value also prepares you for questions on the income side (compensation of employees, operating surplus and so on).
The BEA's quarterly GDP release is reported part by part, just like this formula: "consumer spending slowed", "business investment picked up". Knowing the formula, you can tell whether growth was driven by consumers or by exports. Note that US quarterly growth rates are annualized.
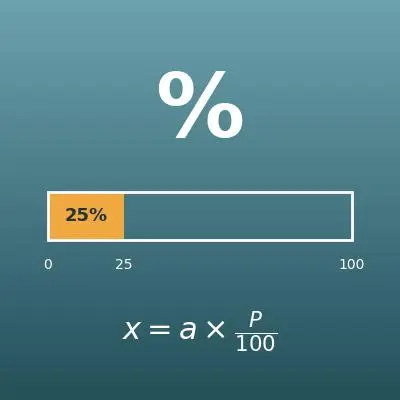
You can also get a sense of scale for "real GDP grew 2%". With US GDP at about $29.3 trillion, 2% is \(29.3 \times 0.02 \approx 0.59\) trillion dollars, about $590 billion more production in a year.
The size of policies such as defense spending, education spending and government debt is usually described internationally as a "percent of GDP". Knowing that GDP is the denominator, you can convert it yourself: for example, NATO's guideline of spending "2% of GDP" on defense is about \(29.3 \times 0.02 \approx 0.59\) trillion dollars for the US.
This formula is the basis for making sense of huge numbers by comparing them with the size of the whole economy.
Reports that compare how well off countries are usually use GDP per capita, GDP divided by the population, rather than GDP itself. A large economy can still have modest income per person if the population is large.
It also helps to know that comparisons of nominal values are affected by exchange rates, so GDP per capita adjusted for purchasing power parity (PPP) is often used. This keeps you from misreading the data.
A sense of scale such as "US consumer spending is about $19.9 trillion" and "investment (equipment, housing and inventories) is about $5.3 trillion" is a starting point for estimating market sizes or explaining where an industry stands in a business plan.
For example, a "$1 trillion market" is about \(1 \div 19.9 \approx 5\%\) of all US consumer spending, a huge market, which you can feel by comparing it with the parts of the formula.
Formulas and graphs
Symbols and terms
Symbols
| \(\mathrm{GDP}\) | G D P | Gross domestic product. The total value added of all goods and services produced within the country in a period (a quarter or a year). |
| \(C\) | C | Consumption. Total household spending on goods and services (personal consumption expenditures, PCE, in US statistics). |
| \(I\) | I | Investment. Business spending on equipment and buildings, plus residential investment (new homes) and the change in inventories (gross private domestic investment in US statistics). In a year when inventories fall, the change in inventories is negative. |
| \(G\) | G | Government spending. Government consumption (public services and so on) plus government investment. Transfer payments such as Social Security benefits are not spending on production, so they are not included. |
| \(X\) | X | Exports (from "eXport"). Total goods and services sold to other countries. |
| \(M\) | M | Imports (from "iMport"). Total goods and services bought from other countries. They are not produced at home, so they are subtracted at the end of the formula. |
| \(\mathit{NX}\) | N X | Net exports. Exports minus imports (\(X - M\)); it can be negative. |
| \(W\) | W | Compensation of employees (from "wages"). Wages, salaries and bonuses paid to workers, plus employer contributions such as social insurance. |
| \(\mathit{OS}\) | O S | Operating surplus and mixed income. Business profits (operating surplus) plus the income of self-employed people (mixed income). |
| \(D\) | D | Consumption of fixed capital (from "depreciation"). The loss in value of buildings, machines and other capital as they wear out. |
| \(T\) | T | Taxes on production and imports, such as sales taxes, excise taxes and customs duties. |
| \(S\) | S | Subsidies paid by the government to businesses and others. In the income approach they are subtracted from taxes. |
Terms
| GDP (gross domestic product) | The total value added of all goods and services produced within the country in a period (a quarter or a year). It is the most widely used measure of the size of an economy. In the US it is published by the Bureau of Economic Analysis (BEA). |
| value added | The new value created by production - sales minus the cost of materials and other inputs. GDP adds up value added across the whole country. If you simply added a bakery's sales to the farmer's sales, the wheat would be counted twice, so only the value added at each step is counted. |
| three approaches to GDP | GDP can be measured from production (value added), from income or from spending, and in theory all three give the same value, because what someone produces becomes someone's income and is bought with someone's spending. (Real statistics show a small gap from different data sources, called the statistical discrepancy.) |
| GNI (gross national income) | The total income earned by a country's residents, rather than what is produced within its borders. It is GDP plus net income from abroad (such as interest and dividends on foreign investments), and it used to be called GNP (gross national product). For countries whose companies earn a lot abroad, GNI is larger than GDP. |
| nominal GDP | GDP added up at that year's prices. When prices rise, nominal GDP goes up even if the amount produced stays the same. |
| real GDP | Nominal GDP with the effect of price changes removed. The growth rates in the news, which tell you whether the economy really grew, are normally based on real GDP. |
| economic growth rate | The percentage by which GDP grew from the previous period. "Real GDP grew 2%" means the amount produced, with price effects removed, grew by 2%. In the US, the BEA releases GDP every quarter, and the quarterly growth rate is reported as an annualized rate (the rate it would be if it continued for a whole year). |
| compensation of employees | The wages, salaries and bonuses that employees receive, plus employer contributions such as social insurance. It is the largest part on the income side, about half of US GDP. |
| operating surplus | The profit from businesses' production. On the income side of GDP it is listed next to compensation of employees and mixed income. In US statistics it covers corporate profits, rental income and net interest, among others. |
| mixed income | The income of self-employed people (proprietors' income in the US). It is called mixed because it combines pay for the owner's own work and the profit of the business. |
| consumption of fixed capital | The loss in value of buildings, machines, roads and other capital as they are used and grow old. It is close to depreciation in business accounting, and the "gross" in gross domestic product means this amount is included. |
| taxes on production and imports | Taxes on producing, selling and importing goods and services, such as sales taxes, excise taxes on alcohol and tobacco, customs duties and business property taxes. Market prices include these taxes, so they appear on the income side (income taxes and corporate income taxes are not included here). |
| net exports | Exports minus imports. It shows how much a country earned from trade with other countries, and it is negative in a year with more imports than exports (a trade deficit). |
| national accounts | The system for producing GDP and other economic statistics under common international rules (the System of National Accounts, SNA). In the US, the BEA produces them as the National Income and Product Accounts (NIPA), and the income-side categories on this page follow this system. |
| GDP per capita | GDP divided by the population. Rather than the size of an economy, it is a guide to how well off and productive people are on average, and it is often used to compare countries. |
| statistical discrepancy | The gap between GDP measured from spending and GDI measured from income, caused by differences in the data sources. For the US in 2024 it was about $0.3 trillion, about 1% of GDP. |
Good to know before you start
Here is what helps you use the calculation on this page with real understanding, not just by pressing the button.
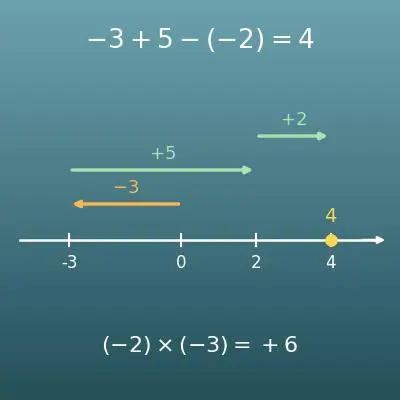
| Adding and subtracting positive and negative numbers (Grade 7) |
|
| Large numbers and place value (Grades 4–5) |
|
| Percents (Grade 6) |
|
| GDP and how it is measured (high school economics) |
|
How to calculate it in Excel
| Consumption C | 335 |
| Investment I | 145 |
| Government spending G | 160 |
| Exports X | 140 |
| Imports M | 145 |
| Net exports (X − M) | =B4-B5 |
| GDP (gross domestic product) | =B1+B2+B3+B6 |
| Compensation of employees W | 310 |
| Operating surplus and mixed income OS | 100 |
| Consumption of fixed capital D | 175 |
| Taxes on production and imports T | 57 |
| Subsidies S | 7 |
| Taxes − subsidies (T − S) | =B4-B5 |
| GDP (gross domestic product) | =B1+B2+B3+B6 |
| Exports X | 140 |
| Imports M | 145 |
| Net exports NX | =B1-B2 |
In the first table, B6 (net exports) shows -5 and B7 (GDP) shows 635. In the second table, B6 shows 50 and B7 shows 635, and in the third table, B3 shows -5.
Just replace the numbers in column B with your own amounts (all in the same unit).
How to calculate it in Google Sheets
| Consumption C | 335 |
| Investment I | 145 |
| Government spending G | 160 |
| Exports X | 140 |
| Imports M | 145 |
| Net exports (X − M) | =B4-B5 |
| GDP (gross domestic product) | =B1+B2+B3+B6 |
| Compensation of employees W | 310 |
| Operating surplus and mixed income OS | 100 |
| Consumption of fixed capital D | 175 |
| Taxes on production and imports T | 57 |
| Subsidies S | 7 |
| Taxes − subsidies (T − S) | =B4-B5 |
| GDP (gross domestic product) | =B1+B2+B3+B6 |
| Exports X | 140 |
| Imports M | 145 |
| Net exports NX | =B1-B2 |
How to calculate it in Python
# Expenditure approach: GDP = C + I + G + (X - M)   (example unit: billions of dollars)
personal_consumption = 335    # consumption C
private_investment = 145      # investment I
government_spending = 160     # government spending G (government consumption + investment)
exports = 140                 # exports X
imports_value = 145           # imports M ("import" is a Python keyword, so the name is different)

net_exports = exports - imports_value
gdp_expenditure = personal_consumption + private_investment + government_spending + net_exports

# Income approach: GDP = W + OS + D + (T - S)
employee_compensation = 310       # compensation of employees W
operating_surplus = 100           # operating surplus and mixed income OS
fixed_capital_consumption = 175   # consumption of fixed capital D
taxes_on_products = 57            # taxes on production and imports T
subsidies = 7                     # subsidies S

gdp_income = employee_compensation + operating_surplus + fixed_capital_consumption + (taxes_on_products - subsidies)

print(f"Net exports: {net_exports}")
print(f"GDP from spending: {gdp_expenditure}")
print(f"GDP from income: {gdp_income}")
How to write it in LaTeX and other math languages (copy and paste)
GDP = C + I + G + (X − M)
\mathrm{GDP} = C + I + G + (X - M)
<math xmlns="http://www.w3.org/1998/Math/MathML" display="block">
<mrow>
<mi>GDP</mi>
<mo>=</mo>
<mi>C</mi>
<mo>+</mo>
<mi>I</mi>
<mo>+</mo>
<mi>G</mi>
<mo>+</mo>
<mrow><mo>(</mo><mi>X</mi><mo>−</mo><mi>M</mi><mo>)</mo></mrow>
</mrow>
</math>
"GDP" = C + I + G + (X - M)
gdp = c + i + g + (x - m) (* all variables are lowercase because C, I and D are reserved symbols in Mathematica *)
gdp := c + i + g + (x - m); # all variables are lowercase because I and D are reserved in Maple
GDP = C + I + G + (X - M);
GDP = C + I + G + (X − M)
GDP = W + OS + D + (T − S)
\mathrm{GDP} = W + \mathit{OS} + D + (T - S)
<math xmlns="http://www.w3.org/1998/Math/MathML" display="block">
<mrow>
<mi>GDP</mi>
<mo>=</mo>
<mi>W</mi>
<mo>+</mo>
<mi>OS</mi>
<mo>+</mo>
<mi>D</mi>
<mo>+</mo>
<mrow><mo>(</mo><mi>T</mi><mo>−</mo><mi>S</mi><mo>)</mo></mrow>
</mrow>
</math>
"GDP" = W + "OS" + D + (T - S)
gdp = w + os + d + (t - s) (* all variables are lowercase because D, C and I are reserved symbols in Mathematica *)
gdp := w + os + d + (t - s); # all variables are lowercase because D is the differential operator in Maple
GDP = W + OS + D + (T - S);
GDP = W + OS + D + (T − S)
NX = X − M
\mathit{NX} = X - M
<math xmlns="http://www.w3.org/1998/Math/MathML" display="block">
<mrow>
<mi>NX</mi>
<mo>=</mo>
<mi>X</mi>
<mo>−</mo>
<mi>M</mi>
</mrow>
</math>
"NX" = X - M
nx = x - m (* lowercase to match the other formulas (N, C, D and I are reserved symbols in Mathematica) *)
nx := x - m; # lowercase to match the other formulas (D and I are reserved in Maple)
NX = X - M;
NX = X − M
How to have ChatGPT do the calculation
You are a calculation assistant for economic statistics. Do the following calculation by actually running Python code, and base your answer only on the numbers from the execution result (do not answer by mental math or guessing).

A country's spending-side figures are: consumption 335, investment 145, government spending 160, exports 140 and imports 145 (all in billions of dollars).
Find each of the following:
1. Net exports (exports − imports)
2. GDP (= consumption + investment + government spending + net exports)
3. The increase in GDP if it grows 2% next year

Show the formulas you used and the numbers from the execution result.
How to Use
-
1Enter your numbersType the numbers you want to calculate with into the input fields
-
2CalculatePress the "Calculate" button
-
3Check the resultThe result appears on the spot. The same page also explains the idea behind the calculation and the formula
DataChef Features

No technical knowledge required.
Intuitive and user-friendly operation.

Can be used without registering personal information.

Automatic file deletion by clicking "download".

and rapid file conversion.

No attribution required.

No need to contact us for commercial use permission.
Related Features
Percentage Change Calculator (Increase and Decrease)
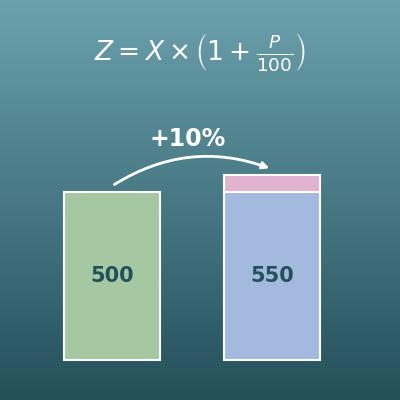
Finds a rate of change, such as "GDP grew 2% from the year before"
Sales Tax Calculator (Add or Remove Sales Tax and VAT)
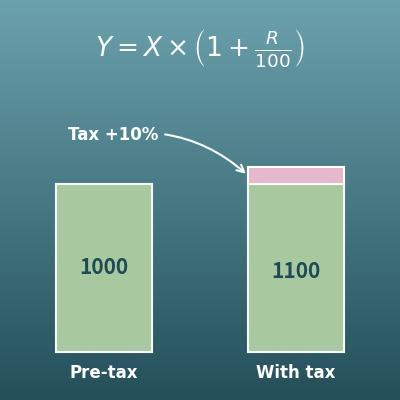
Calculates sales tax, a typical example of the "taxes on production and imports" in the income approach to GDP
Profit Margin Calculator (Cost, Revenue, Profit and Markup)
Finds profit and profit margin from cost and revenue. An everyday way to measure business profits, the source of the operating surplus