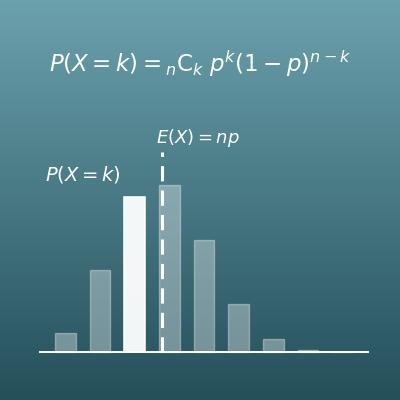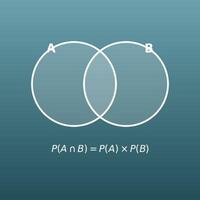
Enter the probability for one trial and the number of trials. Events A and B are calculated at the same time, and the probabilities of their combinations are shown too.
Table of Contents
-
What you can do on this page
-
What is this calculation used for?
-
How to Use
-
Formula
-
Symbols and terms
-
Good to know before you start
-
How to calculate it in Excel
-
How to calculate it in Google Sheets
-
How to calculate it in Python
-
How to write it in LaTeX and other math languages (copy and paste)
-
How to have ChatGPT do the calculation
-
DataChef Features
-
Related Features
-
NumberChef Calculators List
What you can do on this page
- Enter the probability for one trial and the number of trials, and you get the probability that it happens \(n\) times in a row on the spot
- It also calculates the probability that it happens at least once and the probability that it never happens, all at once
- It works with two events, A and B, at the same time, so you can also get combinations such as "A happens at least once and B never happens"
- A plain-language explanation of the formulas and copy-and-paste formulas for Excel, Google Sheets and Python are all on this page
What is this calculation used for?
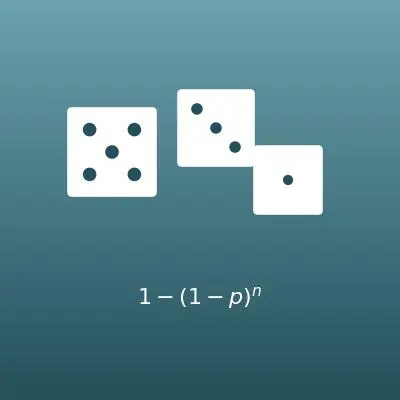
"If I open a loot box with a 1% drop rate 100 times, I should get the item at least once." In fact, the chance of at least one drop is \(1 - 0.99^{100} \approx 0.634\) (63.4%), so about 1 in 3 players still get nothing after 100 tries.
Knowing the "at least once" formula lets you plan your spending and number of tries with numbers instead of gut feeling.
A test can come back "positive" even when you do not have the disease (a false positive), and this happens a few percent of the time on each test. If it is 5% per test, the chance of having at least one false positive over 10 years of yearly screening is as high as \(1 - 0.95^{10} \approx 0.4\) (40%).
Knowing that a flagged result is not the same as having the disease, and that almost anyone may see one if they repeat a test often enough, helps you stay calm when asked to come back for a retest. It is one of the most useful ways this formula helps sort out a big worry with numbers.
A "100-year flood" is a flood with a 1% chance of happening in any given year. Over a 30-year mortgage, the chance of at least one such flood is \(1 - 0.99^{30} \approx 0.26\) (26%), more than 1 in 4. (Real flood risk assessments use more detailed models, but the idea is the same.)
Once you understand this formula, you can see that "it did not happen this year" does not make you safe, and that the probability steadily builds up as the period gets longer. This helps with decisions such as buying flood insurance or keeping emergency supplies.
In a product with 10 parts, each with a 0.5% defect rate, the probability that not a single part is defective is \((1 - 0.005)^{10} \approx 0.951\) (95.1%).
The more parts there are, the lower the chance that "every part is good". Manufacturers use this formula to estimate the pass rate of the whole product and work backward to find the defect rate allowed for each part.
If you enter a drawing with a 10% chance of winning 7 times, the chance of winning at least once is \(1 - 0.9^{7} \approx 0.52\) (52%), just over even odds.
Being able to calculate "how many tries give me about a 50% chance" makes it easier to decide where to put your time and effort.
Formula
Symbols and terms
Symbols
| \(p\) | p | The probability that the event happens in one trial. (Example - a loot box with a 0.25 chance of a rare item) |
| \(n\) | n | The number of trials. (Example - for 4 tries, \(n = 4\)) |
| \(p^n\) | p to the n-th power | \(p\) multiplied by itself \(n\) times. The small \(n\) at the upper right is the exponent, meaning "multiply \(n\) times". (Example - \(0.5^3 = 0.5 \times 0.5 \times 0.5 = 0.125\)) |
| \(1-p\) | one minus p | The probability that the event does not happen in one trial (the probability of the complement). |
| \(P\) | capital P | The probability you want to find. On this page it stands for things like the probability of \(n\) in a row or the probability of at least once. |
Terms
| event | Something that either happens or does not, such as "rolling a 6" or "winning a raffle". In probability, such outcomes are called events. |
| trial | One single run of an action with a chance outcome, such as one roll of a die or one draw of a ticket. The formulas on this page are for repeating the same trial \(n\) times. |
| independent | When an earlier result does not change how likely the next one is. Dice and coins have the same probability on every throw, however many times you throw them, so the throws are independent. |
| repeated trials | Doing the same trial under the same conditions many times. In statistics courses, independent repeated trials with two outcomes (happens or not) are called Bernoulli trials, and they are the basis of the binomial distribution. |
| complement | The opposite event, that the event does not happen. The complement of "happens at least once" is "never happens", and this switch is the key to the third formula on this page. |
| exponent (power) | Multiplying the same number by itself several times. In \(0.5^3\), the small number at the upper right (the exponent) tells how many times to multiply. |
Good to know before you start
Here is what helps you use the calculation on this page with real understanding, not just by pressing the button.
| Basic probability (Grade 7) |
|
| Exponents (Grade 6) |
|
| The complement (Grade 7 to high school) |
|
| Multiplying decimals (Grades 5–6) |
|
How to calculate it in Excel
| Probability in one trial p | 0.25 |
| Number of trials n | 4 |
| Probability of n in a row | =B1^B2 |
| Probability in one trial p | 0.25 |
| Number of trials n | 4 |
| Probability of never | =(1-B1)^B2 |
| Probability in one trial p | 0.25 |
| Number of trials n | 4 |
| Probability of at least once | =1-(1-B1)^B2 |
"^" is the symbol for a power (how many times to multiply). "=B1^B2" means "multiply the value in B1 by itself B2 times".
In the third table, for example, B3 shows about 0.684 (about 68%). Just replace B1 and B2 with your own numbers.
How to calculate it in Google Sheets
| Probability in one trial p | 0.25 |
| Number of trials n | 4 |
| Probability of n in a row | =B1^B2 |
| Probability in one trial p | 0.25 |
| Number of trials n | 4 |
| Probability of never | =(1-B1)^B2 |
| Probability in one trial p | 0.25 |
| Number of trials n | 4 |
| Probability of at least once | =1-(1-B1)^B2 |
How to calculate it in Python
probability_per_trial = 0.25  # probability in one trial
number_of_trials = 4          # number of trials

p_every_time = probability_per_trial ** number_of_trials        # probability of n in a row
p_never = (1 - probability_per_trial) ** number_of_trials       # probability of never
p_at_least_once = 1 - p_never                                   # probability of at least once

print(f"Probability of {number_of_trials} in a row: {p_every_time}")
print(f"Probability of never: {p_never}")
print(f"Probability of at least once: {p_at_least_once}")
How to write it in LaTeX and other math languages (copy and paste)
P = pⁿ
P = p^{n}
<math xmlns="http://www.w3.org/1998/Math/MathML" display="block">
  <mrow>
    <mi>P</mi>
    <mo>=</mo>
    <msup><mi>p</mi><mi>n</mi></msup>
  </mrow>
</math>
P = p^n
p^n
P := p^n;
P = p^n;
P = p^n
P = (1 − p)ⁿ
P = (1-p)^{n}
<math xmlns="http://www.w3.org/1998/Math/MathML" display="block">
<mrow>
<mi>P</mi>
<mo>=</mo>
<msup>
<mrow><mo>(</mo><mn>1</mn><mo>−</mo><mi>p</mi><mo>)</mo></mrow>
<mi>n</mi>
</msup>
</mrow>
</math>
P = (1 - p)^n
(1 - p)^n
P := (1 - p)^n;
P = (1 - p)^n;
P = (1 - p)^n
P = 1 − (1 − p)ⁿ
P = 1 - (1-p)^{n}
<math xmlns="http://www.w3.org/1998/Math/MathML" display="block">
<mrow>
<mi>P</mi>
<mo>=</mo>
<mn>1</mn>
<mo>−</mo>
<msup>
<mrow><mo>(</mo><mn>1</mn><mo>−</mo><mi>p</mi><mo>)</mo></mrow>
<mi>n</mi>
</msup>
</mrow>
</math>
P = 1 - (1 - p)^n
1 - (1 - p)^n
P := 1 - (1 - p)^n;
P = 1 - (1 - p)^n;
P = 1 - (1 - p)^n
How to have ChatGPT do the calculation
You are a probability calculation assistant. Do the following calculation by actually running Python code, and base your answer only on the numbers from the execution result (do not answer by mental math or guessing).

I open a loot box 4 times. Each time, the chance of a rare item is 0.25. The results are independent.
Find each of the following:
1. The probability of getting a rare item all 4 times
2. The probability of missing all 4 times
3. The probability of getting at least one rare item

Show the formulas you used and the numbers from the execution result.
How to Use
-
1Enter your numbersType the numbers you want to calculate with into the input fields
-
2CalculatePress the "Calculate" button
-
3Check the resultThe result appears on the spot. The same page also explains the idea behind the calculation and the formula
DataChef Features

No technical knowledge required.
Intuitive and user-friendly operation.

Can be used without registering personal information.

Automatic file deletion by clicking "download".

and rapid file conversion.

No attribution required.

No need to contact us for commercial use permission.
Related Features
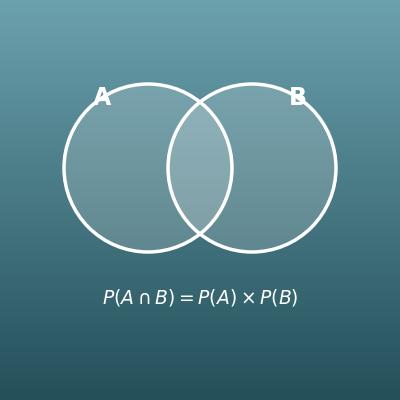
Probability of Two Events (And, Or, Neither)
Finds the probability that both happen, that at least one happens, and more, from two probabilities
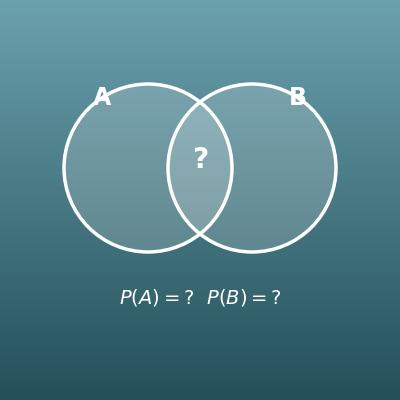
Probability of Two Events Solver
Works backward from any two known probabilities to find all the others
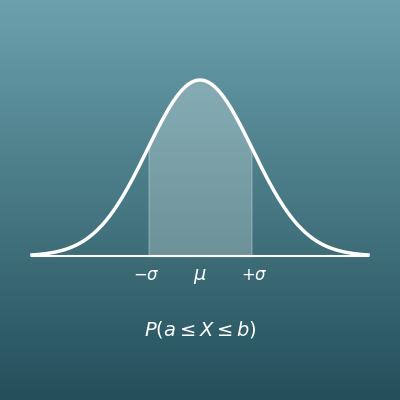
Normal Distribution Probability Calculator
Finds the probability of falling in a given range from the mean and standard deviation