




























































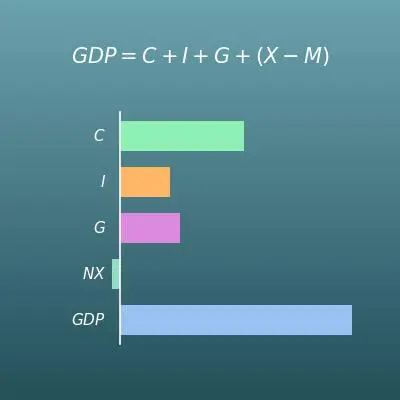
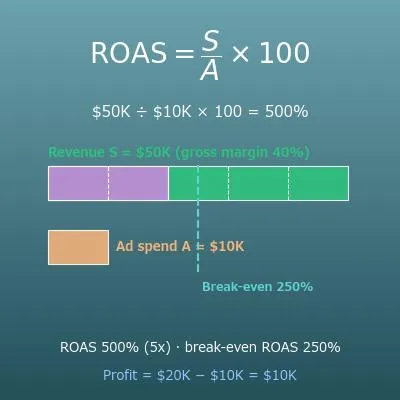
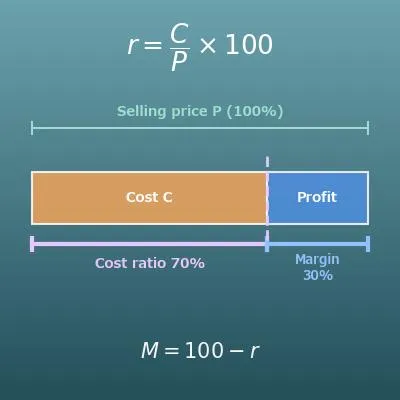



























Enter the two you know out of revenue, ad spend and ROAS (%), leave the third blank, and press "Calculate". The blank one is calculated. Enter your gross margin (%) as well to get the break-even ROAS, the profit after ad spend and the ROI on ad spend, with a chart of revenue, ad spend, gross profit and break-even.
Table of Contents
-
What you can do on this page
-
What is this calculation used for?
-
How to Use
-
Formulas and figures
-
Formula for ROAS (return on ad spend)
-
Formula for the required revenue (from a target ROAS and ad spend)
-
Formula for the max ad spend (from a target ROAS and revenue)
-
Formula for the break-even ROAS (from gross margin)
-
Formula for the profit after ad spend (from revenue, gross margin and ad spend)
-
Formula for the ROI on ad spend (how it differs from ROAS)
-
-
Symbols and terms
-
Good to know before you start
-
How to calculate it in Excel
-
How to calculate it in Google Sheets
-
How to calculate it in Python
-
How to write it in LaTeX and other math languages (copy and paste)
-
How to have ChatGPT do the calculation
-
DataChef Features
-
Related Features
-
NumberChef Calculators List
What you can do on this page
- Enter any two of revenue, ad spend and ROAS (return on ad spend), and the third is calculated (ROAS is shown both as a percentage and as a multiple)
- "I spent $10,000 on ads and made $50,000. What is my ROAS?" "With a target ROAS of 400% and $15,000 in ad spend, how much revenue do I need?" "With $90,000 in revenue, what is the most I can spend and still keep a 300% ROAS?" This one page answers these ad budget questions
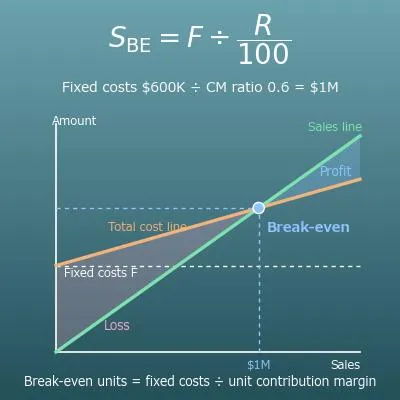
- Enter your gross margin (%) and you also get the break-even ROAS (the lowest ROAS at which gross profit still covers the ad spend), the break-even revenue, the profit after ad spend and the ROI on ad spend
- A chart shows revenue, ad spend, gross profit and the break-even point at a glance
- A plain-language explanation of the formulas and copy-and-paste formulas for Excel, Google Sheets and Python are all on this page
What is this calculation used for?
If $10,000 in ad spend brings in $50,000 in revenue, the ROAS is \(50000 \div 10000 \times 100 = 500\)% (5x). That looks strong, but if the product's gross margin is 40%, the break-even ROAS is \(100 \div 40 \times 100 = 250\)%. 500% is twice that, and you can confirm a profit of $10,000: $20,000 of gross profit minus $10,000 of ad spend.
On the other hand, with the same 500% ROAS, a thin-margin product with a 15% gross margin has a break-even ROAS of about 667%, so it loses money. This comparison shows that "high ROAS" is not always "profitable".
In Google Ads and Meta Ads you can set a target ROAS for automated bidding. With a 40% gross margin, the break-even ROAS is 250%, so any target below that accepts a loss. If you want to keep a profit, decide for example "I want 10% of revenue left as profit after ad spend", and set the target ROAS at \(100 \div (40 - 10) \times 100 \approx 333\)% (the break-even ROAS formula with "gross margin" replaced by "gross margin − target profit margin").
If the target ROAS is too high, the platform may cut back your ad delivery and your total sales may drop. In practice, marketers adjust it while balancing the break-even ROAS against sales volume.
Suppose you expect about $90,000 in revenue from ads next month. With a target ROAS of 300%, the max ad spend is \(90000 \div 300 \times 100 = 30000\) dollars. If you spend more than this, the ROAS falls below the target.
"How much can we spend?" is one of the questions marketers hear most. With a target ROAS (or the break-even ROAS) and expected revenue, this formula gives a ceiling you can back up with numbers.
Suppose you want $600,000 in revenue from ads this quarter, and your ROAS has been around 400%. The ad spend you need is roughly \(600000 \div 400 \times 100 = 150000\) dollars (the same form as the max ad spend formula).
In a budget request, showing revenue, ad spend and profit together is more convincing: "$150,000 in ad spend for an expected $600,000 in revenue; at a 40% gross margin that is $240,000 of gross profit and $90,000 of profit after ad spend". ROAS usually falls as you scale up spend, so build some slack into the plan.
Even if the same ad spend sells the same amount, a different gross margin changes the result. Product A with a 60% gross margin has a break-even ROAS of \(100 \div 60 \times 100 \approx 167\)%, and product B with a 25% gross margin has 400%. If both sell at a 300% ROAS, A makes money and B loses money.
With a break-even ROAS for each product, you can sort products into "worth advertising" and "sell without ads" by the numbers.
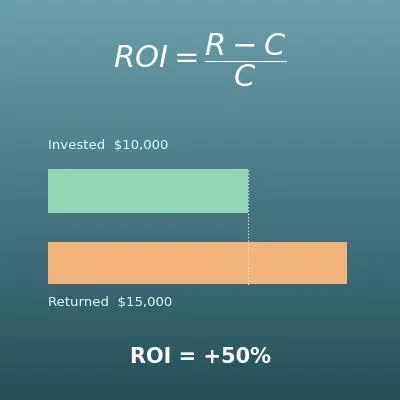
A common mix-up: the marketing team reports "500% ROAS", and management hears "profit went up 5 times". With $50,000 in revenue, $10,000 in ad spend and a 40% gross margin, the ROAS is 500%, but the ROI on ad spend is \((20000 - 10000) \div 10000 \times 100 = 100\)% (a profit equal to the ad spend).
Use ROAS for day-to-day campaign work and ROI (or profit in dollars) for business decisions, and always state which metric a number is.
Formulas and figures
Symbols and terms
Symbols
| \(\mathrm{ROAS}\) | R-O-A-S (or "roe-as") | Return on ad spend (Return On Advertising Spend). Revenue as a percentage of ad spend, found with \(\mathrm{ROAS} = S \div A \times 100\). |
| \(S\) | ess | Revenue, from the first letter of "sales". The total revenue that came from the ads. (Example - if the ads brought in $50,000, \(S = 50000\)) |
| \(A\) | ay | Ad spend, from the first letter of "advertising". The total spent on ads to get that revenue. It is the divisor (the base) in the ROAS division. |
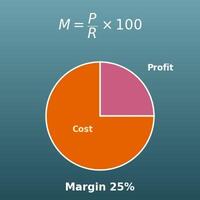
| \(M\) | em | Gross margin, from the first letter of "margin". Gross profit (revenue − cost of goods) as a percentage of revenue. (Example - if the cost of goods is 60% of the price, \(M = 40\)) |
| \(P\) | pee | Profit after ad spend, from the first letter of "profit". What is left after subtracting ad spend from gross profit: \(P = S \times M \div 100 - A\). |
| \(\mathrm{ROI}\) | R-O-I | Return on investment. Profit as a percentage of the amount invested. On this page the investment is the ad spend, so \(\mathrm{ROI} = P \div A \times 100\). |
| \(\mathrm{ROAS}_{\text{BE}}\) | break-even ROAS | Break-even ROAS (BE stands for break-even). The ROAS at which gross profit exactly pays back the ad spend (profit is 0): \(100 \div M \times 100\). |
| \(100\) | one hundred | The base for percentages. Multiply a multiple by 100 to get a percentage, and divide a percentage by 100 to get back the multiple (\(5 \times 100 = 500\%\), \(500\% \div 100 = 5\)). |
Terms
| ROAS (return on ad spend) | A metric for how much revenue the ads brought in compared with what they cost. It is shown as a percentage (revenue ÷ ad spend × 100) or as a multiple (revenue ÷ ad spend). In Google Ads it appears as "Conv. value / cost", which is the same number when the conversion value is set to the purchase amount. It is used to compare the efficiency of ads and campaigns. Because it is based on revenue, you need to pair it with the break-even ROAS to judge profit or loss after the cost of goods. |
| break-even ROAS | The ROAS at which gross profit exactly pays back the ad spend (profit after ad spend is 0). Found with "100 ÷ gross margin × 100" (%). If your actual ROAS is higher, you make money; if it is lower, you lose money. It is the floor when you set a target ROAS. |
| break-even revenue | The revenue at which gross profit exactly equals the ad spend ("ad spend ÷ gross margin × 100"). At this revenue, the ROAS equals the break-even ROAS. It is the break-even point idea applied to ad spend. |
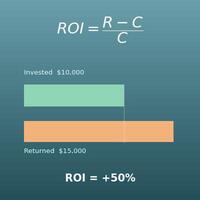
| ROI (return on investment) | Profit as a percentage of the amount invested ("profit ÷ investment × 100"). Unlike ROAS, the top of the fraction is profit, so 0% is break-even and a negative value is a loss. On this page the investment is the ad spend. |
| gross profit | Revenue minus the cost of goods sold (what you paid to buy or make the products). It is the profit before costs such as salaries and rent. Ad spend has to be paid out of this gross profit. |
| gross margin | Gross profit as a percentage of revenue ("gross profit ÷ revenue × 100"). Added to the cost of goods as a percentage of revenue, it makes 100% (gross margin = 100 − cost of goods %). You need it for the break-even ROAS, and you can find it on the profit margin calculator page. |
| ad spend | What you paid to run the ads. For online ads, it is the total paid to the ad platform for clicks or impressions. Companies differ on whether to include creative production or staff costs, so when you compare ROAS, compare values calculated the same way. |
| target ROAS | The ROAS you decide to aim for. It is usually set at the break-even ROAS plus a margin for profit. In Google Ads you can set it for automated bidding as "Target ROAS", just as you can set a target CPA. Some businesses accept a lower target on first orders when the customer's LTV (repeat purchases) makes up for it. |
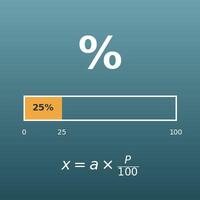
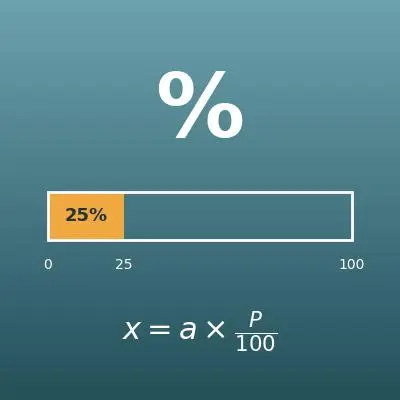
| percent equation | The relation "part = percent × whole", which can also be written "percent = part ÷ whole" and "whole = part ÷ percent". The three formulas on this page for ROAS, required revenue and max ad spend are these three forms, with revenue as the part and ad spend as the whole. |
Good to know before you start
Here is what helps you use the calculation on this page with real understanding, not just by pressing the button.
| Percents (Grades 6–7) |
|
| The percent equation (Grade 7) |
|
| Multiplying and dividing decimals (Grades 5–6) |
|
| Revenue, cost and profit (personal finance and business basics) |
|
| Variables and rearranging equations (Grades 7–8) |
|
How to calculate it in Excel
| Revenue S ($) | 50000 |
| Ad spend A ($) | 10000 |
| ROAS (%) | =B1/B2*100 |
| Ad spend A ($) | 15000 |
| Target ROAS (%) | 400 |
| Required revenue S ($) | =B1*B2/100 |
| Revenue S ($) | 90000 |
| Target ROAS (%) | 300 |
| Max ad spend A ($) | =B1/B2*100 |
| Gross margin M (%) | 40 |
| Break-even ROAS (%) | =100/B1*100 |
| Revenue S ($) | 50000 |
| Gross margin M (%) | 40 |
| Ad spend A ($) | 10000 |
| Profit after ad spend P ($) | =B1*B2/100-B3 |
| ROI on ad spend (%) | =B4/B3*100 |
For example, B3 of the first table shows 500 (ROAS 500%), B3 of the second shows 60000 (required revenue $60,000), B3 of the third shows 30000 (max ad spend $30,000), B2 of the fourth shows 250 (break-even ROAS 250%), and in the fifth B4 shows 10000 (profit $10,000) and B5 shows 100 (ROI 100%). Just replace the inputs with your own numbers.
How to calculate it in Google Sheets
| Revenue S ($) | 50000 |
| Ad spend A ($) | 10000 |
| ROAS (%) | =B1/B2*100 |
| Ad spend A ($) | 15000 |
| Target ROAS (%) | 400 |
| Required revenue S ($) | =B1*B2/100 |
| Revenue S ($) | 90000 |
| Target ROAS (%) | 300 |
| Max ad spend A ($) | =B1/B2*100 |
| Gross margin M (%) | 40 |
| Break-even ROAS (%) | =100/B1*100 |
| Revenue S ($) | 50000 |
| Gross margin M (%) | 40 |
| Ad spend A ($) | 10000 |
| Profit after ad spend P ($) | =B1*B2/100-B3 |
| ROI on ad spend (%) | =B4/B3*100 |
How to calculate it in Python
revenue = 50000        # revenue from ads ($)
ad_cost = 10000        # ad spend ($)
gross_margin = 40      # gross margin (%)

roas = revenue / ad_cost * 100                 # ROAS (%)
print(f"ROAS: {roas}% ({roas / 100}x)")

# Break-even ROAS: the ROAS at which gross profit exactly pays back the ad spend
break_even_roas = 100 / gross_margin * 100
print(f"Break-even ROAS: {break_even_roas}%")

# Profit after ad spend, and ROI on ad spend
profit = revenue * gross_margin / 100 - ad_cost
roi = profit / ad_cost * 100
print(f"Profit after ad spend: ${profit}")
print(f"ROI on ad spend: {roi}%")

# Work back: required revenue from a target ROAS and ad spend
target_roas = 400
ad_cost2 = 15000
required_revenue = ad_cost2 * target_roas / 100
print(f"Required revenue: ${required_revenue}")

# Work back: max ad spend from a target ROAS and revenue
target_roas2 = 300
revenue2 = 90000
allowed_ad_cost = revenue2 / target_roas2 * 100
print(f"Max ad spend: ${allowed_ad_cost}")
How to write it in LaTeX and other math languages (copy and paste)
ROAS = S ÷ A × 100
\mathrm{ROAS} = \dfrac{S}{A} \times 100
<math xmlns="http://www.w3.org/1998/Math/MathML" display="block">
<mrow>
<mi>ROAS</mi>
<mo>=</mo>
<mfrac><mi>S</mi><mi>A</mi></mfrac>
<mo>×</mo>
<mn>100</mn>
</mrow>
</math>
ROAS = S/A xx 100
revenue/adCost*100
ROAS := revenue/adCost*100;
ROAS = revenue/adCost*100;
ROAS = S/A × 100
S = A × ROAS ÷ 100
S = A \times \dfrac{\mathrm{ROAS}}{100}
<math xmlns="http://www.w3.org/1998/Math/MathML" display="block">
<mrow>
<mi>S</mi>
<mo>=</mo>
<mi>A</mi>
<mo>×</mo>
<mfrac><mi>ROAS</mi><mn>100</mn></mfrac>
</mrow>
</math>
S = A xx ROAS/100
adCost*roas/100
revenue := adCost*roas/100;
revenue = adCost*roas/100;
S = A × ROAS/100
A = S ÷ ROAS × 100
A = \dfrac{S}{\mathrm{ROAS}} \times 100
<math xmlns="http://www.w3.org/1998/Math/MathML" display="block">
<mrow>
<mi>A</mi>
<mo>=</mo>
<mfrac><mi>S</mi><mi>ROAS</mi></mfrac>
<mo>×</mo>
<mn>100</mn>
</mrow>
</math>
A = S/ROAS xx 100
revenue/roas*100
adCost := revenue/roas*100;
adCost = revenue/roas*100;
A = S/ROAS × 100
ROAS_BE = 100 ÷ M × 100
\mathrm{ROAS}_{\text{BE}} = \dfrac{100}{M} \times 100
<math xmlns="http://www.w3.org/1998/Math/MathML" display="block">
<mrow>
<msub><mi>ROAS</mi><mtext>BE</mtext></msub>
<mo>=</mo>
<mfrac><mn>100</mn><mi>M</mi></mfrac>
<mo>×</mo>
<mn>100</mn>
</mrow>
</math>
ROAS_be = 100/M xx 100
100/grossMargin*100
ROAS_be := 100/grossMargin*100;
ROAS_be = 100/grossMargin*100;
ROAS_BE = 100/M × 100
P = S × M ÷ 100 − A
P = S \times \dfrac{M}{100} - A
<math xmlns="http://www.w3.org/1998/Math/MathML" display="block">
<mrow>
<mi>P</mi>
<mo>=</mo>
<mi>S</mi>
<mo>×</mo>
<mfrac><mi>M</mi><mn>100</mn></mfrac>
<mo>−</mo>
<mi>A</mi>
</mrow>
</math>
P = S xx M/100 - A
revenue*grossMargin/100 - adCost
profit := revenue*grossMargin/100 - adCost;
profit = revenue*grossMargin/100 - adCost;
P = S × M/100 − A
ROI = P ÷ A × 100
\mathrm{ROI} = \dfrac{P}{A} \times 100
<math xmlns="http://www.w3.org/1998/Math/MathML" display="block">
<mrow>
<mi>ROI</mi>
<mo>=</mo>
<mfrac><mi>P</mi><mi>A</mi></mfrac>
<mo>×</mo>
<mn>100</mn>
</mrow>
</math>
ROI = P/A xx 100
profit/adCost*100
ROI := profit/adCost*100;
ROI = profit/adCost*100;
ROI = P/A × 100
How to have ChatGPT do the calculation
You are an assistant for online advertising metrics. Do the following calculation by actually running Python code, and base your answer only on the numbers from the execution result (do not answer by mental math or guessing).

I spent $10,000 on ads, and the ads brought in $50,000 in revenue. The product's gross margin is 40%.
Find each of the following:
1. ROAS (revenue ÷ ad spend × 100, as a percentage and as a multiple)
2. Break-even ROAS (100 ÷ gross margin × 100, as a percentage)
3. Profit after ad spend (revenue × gross margin ÷ 100 − ad spend) and ROI on ad spend (profit ÷ ad spend × 100, as a percentage)
4. For a different campaign: the revenue needed to hit a target ROAS of 400% with $15,000 in ad spend (ad spend × ROAS ÷ 100)
5. For yet another campaign: the max ad spend that keeps a target ROAS of 300% with $90,000 in revenue (revenue ÷ ROAS × 100)

Show the formulas you used and the numbers from the execution result.
How to Use
-
1Enter your numbersType the numbers you want to calculate with into the input fields
-
2CalculatePress the "Calculate" button
-
3Check the resultThe result appears on the spot. The same page also explains the idea behind the calculation and the formula
DataChef Features

No technical knowledge required.
Intuitive and user-friendly operation.

Can be used without registering personal information.

Automatic file deletion by clicking "download".

and rapid file conversion.

No attribution required.

No need to contact us for commercial use permission.
Related Features
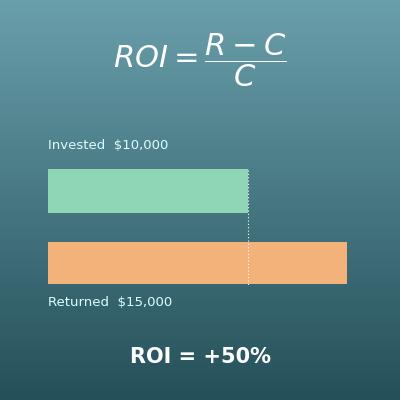
ROI Calculator (Return on Investment and Annualized ROI)
Calculates ROI as profit ÷ investment. Use it when you judge ads or investments by profit, not by revenue
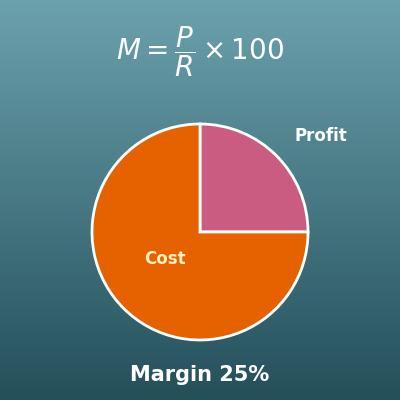
Profit Margin Calculator (Cost, Revenue, Profit and Markup)
Calculates gross margin and markup from cost and revenue. Use it to find the gross margin for this page
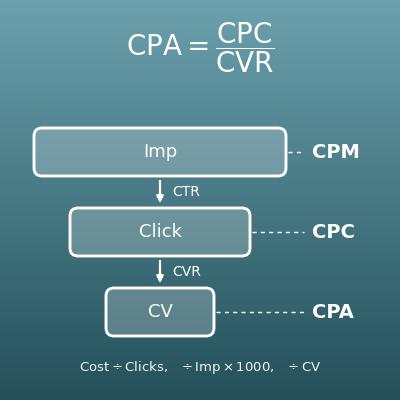
CPC, CPM and CPA Calculator (Ad Cost Metrics and Budget from Target CPA)
Calculates the three ad cost metrics from spend, impressions, clicks and conversions, and works back from a target CPA to max CPC and budget
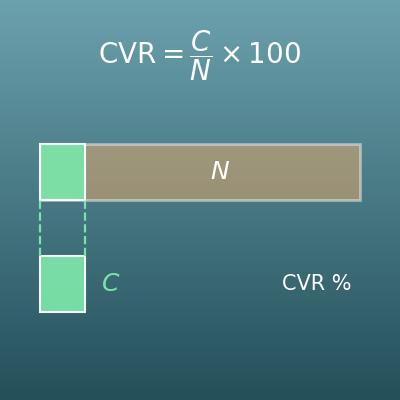
Conversion Rate Calculator (CVR, Visitors Needed and Expected Conversions)
Enter two of visits, conversions and conversion rate to get the third. Also finds the traffic needed for a conversion goal
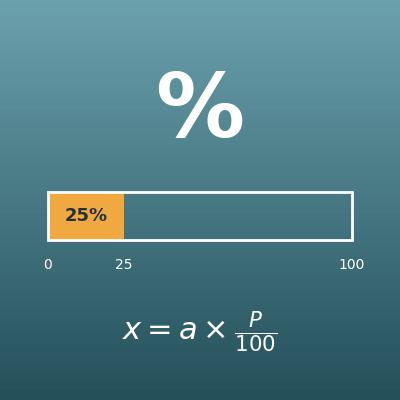
Percentage Calculator (Percent, Part and Whole)
Enter two of the whole, the part and the percent to get the third. For percentages in general, not just ROAS
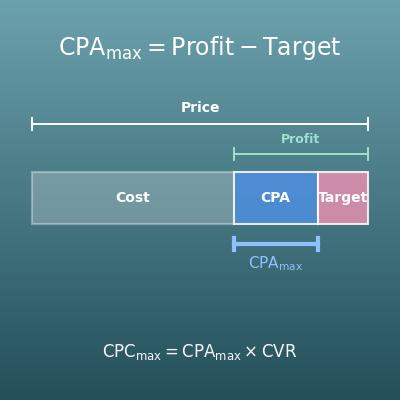
Break-Even CPA and Target CPA Calculator (Max Ad Spend per Conversion and Max CPC)
Finds break-even CPA from average order value and gross margin, target CPA after your profit goal, and max CPC from conversion rate