Choose a mode for what you want to find, then enter the results of your survey. "Capture-recapture" estimates the total number, such as the fish in a pond. "Count in a population" estimates how many in the whole match a condition (such as the total number of defective items).
Table of Contents
-
What you can do on this page
-
What is this calculation used for?
-
How to Use
-
Formula and diagram
-
Symbols and terms
-
Good to know before you start
-
How to calculate it in Excel
-
How to calculate it in Google Sheets
-
How to calculate it in Python
-
How to write it in LaTeX and other math languages (copy and paste)
-
How to have ChatGPT do the calculation
-
DataChef Features
-
Related Features
-
NumberChef Calculators List
What you can do on this page
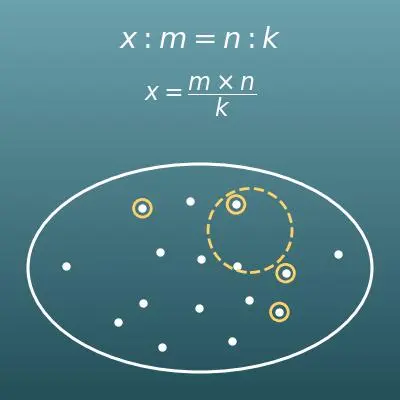
- Estimate the total size of a group you cannot count one by one, such as the fish in a pond, with the capture-recapture method (mark some, release them, catch a second group and check the share that is marked)
- When you know the size of the whole population (for example, 3,000 products), estimate how many in it match a condition (the total number of defective items) from a random sample (for example, 2 defective out of 100)
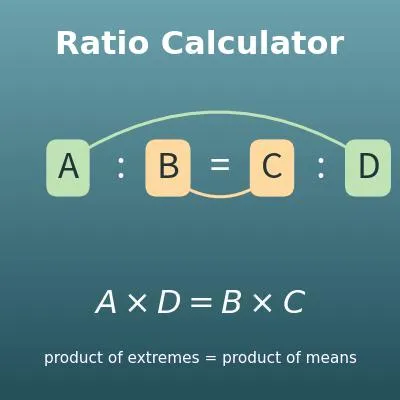
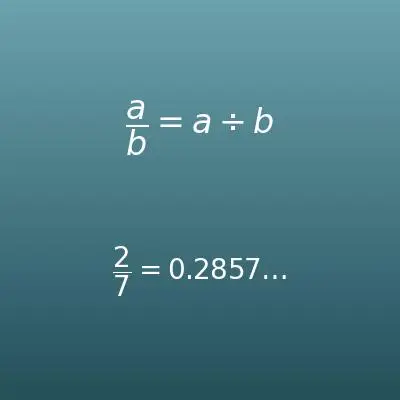
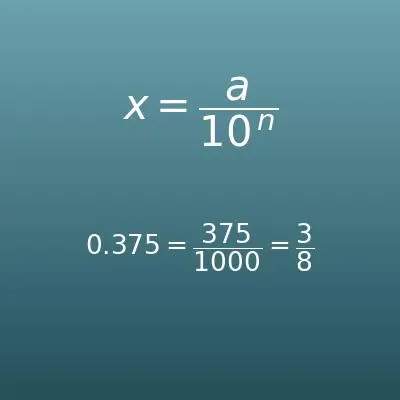
- Shows the steps with a proportion, just as in a middle school textbook (the product of the means equals the product of the extremes). The answer is shown both as the exact result of the division (a fraction) and as a rounded "about ..." number
- A bar diagram lets you compare the share in the sample with the share in the population and see that they are the same
What is this calculation used for?
To count animals that cannot all be counted, such as fish in a pond, deer in the mountains or invasive fish in a lake, researchers really use the capture-recapture method on this page. In fisheries management and invasive species control, the population estimate is the basic data for deciding catch limits and how big a control effort should be.
The method assumes that marks do not fall off, that few animals come or go (are born, die or move) during the study, and that the marked animals mix well with the rest. Real studies choose the timing and the method carefully to come close to these conditions.
Tests that destroy the product or make it unsellable, such as battery life tests or checking the contents of canned food, cannot be done on every item. Instead, a random sample is checked, and the total number of defective items is estimated from the defective share in the sample.
Estimating "about 60 in all" from 2 defective out of a sample of 100 is one of the most basic tools of quality control.
Opinion polls such as the presidential approval rating do not ask every voter in the country. They estimate the share for the whole from a random sample of one thousand to a few thousand people. TV ratings, too, are shares for the whole audience estimated from a sample of households.
The power of sampling is that, as long as the sample is chosen at random, even a small sample can estimate the whole quite accurately (how big the error is depends on the sample size). Real surveys also add steps to avoid bias by region or age group, such as weighting, but the base is this idea of estimating the whole from the share in a sample.
News networks can call a race when only a small share of the votes have been counted because they estimate each candidate's share of the total vote from samples: exit polls (interviews with people who just voted) and the part of the votes already counted.
Applying the share in a sample to the whole is the same idea as the proportion on this page. When calling a race, networks also combine data from past elections and statistical theory and decide carefully.
Formula and diagram
Symbols and terms
Symbols
| \(x\) | ex | The letter used for a number you do not know yet (an unknown). On this page, the estimate you want, such as "the total in the pond" or "the matching count in the population", is called \(x\) to set up the proportion. The custom of using \(x\) for an unknown goes back to math books of the 1600s. |
| \(m\) | em | On this page, "the number caught first and marked". Think of it as m for "marked". It is also often used as a count together with \(n\). |
| \(n\) | en | The number in the sample (the second catch, or the number taken out and checked). It comes from "number" and is the standard letter for a count. In statistics, the sample size is written \(n\) by custom. |
| \(k\) | kay | The number in the sample that matched (the marked ones, the defective ones, and so on). Along with \(n\) and \(m\), it is a common letter for counts and positions. |
| \(N\) | capital N | The size of the whole population. By custom in statistics, the larger group is written with a capital letter to tell it apart from the sample size \(n\) (lowercase). |
| \(a : b\) | a to b | A way of writing a ratio. ":" is the ratio sign and is read "to". An equation that joins two ratios with an equals sign, such as \(a : b = c : d\), is a proportion. |
| \(\approx\) | approximately equal to | The sign for "almost equal". It can also be read "about". An answer from a sample is an estimate, so it is written with this sign or the word "about" instead of an equals sign. |
Terms
| sample survey | A survey that studies only part of the population (a sample) and estimates what the whole looks like. It is used for things you cannot count completely or that are destroyed by testing. Students learn it in Grade 7 as random sampling and making inferences about a population. |
| census | A survey that checks every member of the population. The US Census, taken every 10 years, is an example. Checking everything is accurate, but when it takes too much time or money, or when testing destroys the product, a sample survey is used instead. |
| population | The whole group you want to study, such as all the fish in a pond, all the products a factory made, or all the voters in the country. |
| sample | The part taken from the population that you actually study. |
| sample size | The number of items in the sample. The larger the sample size, the smaller the error of the estimate becomes. |
| random sampling | Taking a sample so that every member has the same chance of being chosen, like drawing names from a hat. No one picks on purpose. It is the basic condition for estimates from a sample to work. |
| capture-recapture | A method that marks (tags) the animals caught, releases them, catches a second group after some time, and estimates the total from the share that is marked. Also called mark and recapture, it is really used to count fish and wildlife. |
| proportion | An equation that says two ratios are equal, such as \(a : b = c : d\). The product of the means equals the product of the extremes, and this property lets you find an unknown number. |
| means | In the proportion \(a : b = c : d\), the inside terms \(b\) and \(c\). The product of the means equals the product of the extremes. (This is not the average.) |
| extremes | In the proportion \(a : b = c : d\), the outside terms \(a\) and \(d\). The product of the means equals the product of the extremes. |
| share | How much of the whole a part takes up, found by dividing the part by the whole. Sample surveys rest on the idea that the share is the same in the population and in the sample. |
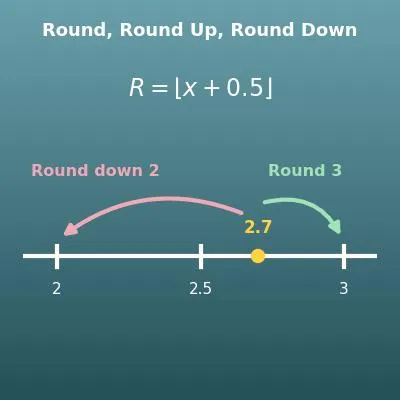
| rounded number | An approximate number, cut off at a convenient place value by rounding. An answer from a sample is an estimate, so the standard way is to give a rounded number such as "about 250". |
| rounding | To round to a place value, look at the digit just to its right. If it is 4 or less, round down; if it is 5 or more, round up. |
| estimate | Judging what the whole looks like from the part of the information you have. An answer found from a sample is called an estimate in this sense. |
| error | The gap between the estimate and the real value. Results from a sample always have some error, and the larger the sample size, the smaller the error becomes. |
Good to know before you start
Here is what helps you use the calculation on this page with real understanding, not just by pressing the button.
If you get stuck, going back over the topics in this table is the fastest way forward.
| Percents and shares (Grade 6) |
|
| Ratios and proportions (Grades 6–7) |
|
| Expressions and one-step equations (Grades 6–7) |
|
| Rounding (Grades 3–4) |
|
How to calculate it in Excel
| Marked first m | 50 |
| 2nd catch n | 30 |
| Marked in 2nd catch k | 6 |
| Estimated total x = m×n÷k | =B1*B2/B3 |
| Rounded to a whole number | =ROUND(B4,0) |
| Extreme a (total; the answer to the pond example) | 250 |
| Mean b (number marked) | 50 |
| Mean c (2nd catch) | 30 |
| Extreme d (marked in 2nd catch) | 6 |
| Product of the means b×c | =B2*B3 |
| Product of the extremes a×d | =B1*B4 |
| Population size N | 3000 |
| Sample size n | 100 |
| Matching in sample k | 2 |
| Estimated count x = N×k÷n | =B1*B3/B2 |
| Rounded to a whole number | =ROUND(B4,0) |
The first table is the pond example (50 marked, 6 marked out of 30 in the second catch), and the answer is 250. When the division does not come out even, B4 shows a decimal, so read B5, which goes through the ROUND function, as the "about ..." answer.
The second table puts the answer 250 in for x in the proportion x : 50 = 30 : 6 and checks that the product of the means (B5) and the product of the extremes (B6) are both 1500, so they are equal.
The third table is the example of 3,000 products with 2 defective out of a sample of 100, and the answer is 60.
How to calculate it in Google Sheets
| Marked first m | 50 |
| 2nd catch n | 30 |
| Marked in 2nd catch k | 6 |
| Estimated total x = m×n÷k | =B1*B2/B3 |
| Rounded to a whole number | =ROUND(B4,0) |
| Extreme a (total; the answer to the pond example) | 250 |
| Mean b (number marked) | 50 |
| Mean c (2nd catch) | 30 |
| Extreme d (marked in 2nd catch) | 6 |
| Product of the means b×c | =B2*B3 |
| Product of the extremes a×d | =B1*B4 |
| Population size N | 3000 |
| Sample size n | 100 |
| Matching in sample k | 2 |
| Estimated count x = N×k÷n | =B1*B3/B2 |
| Rounded to a whole number | =ROUND(B4,0) |
How to calculate it in Python
from fractions import Fraction

# Capture-recapture: estimating the total number in the pond
marked_first = 50       # number caught first and marked, m
caught_second = 30      # number in the second catch, n
marked_in_second = 6    # number marked in the second catch, k

estimated_total = Fraction(marked_first * caught_second, marked_in_second)
# Adding Fraction(1, 2) and dropping the fraction part rounds 0.5 up every time
approx_total = int(estimated_total + Fraction(1, 2))
print(f"Estimated total (fraction): {estimated_total}")
print(f"Estimated total (rounded): about {approx_total}")

# Estimating the matching count in a population
population = 3000       # population size, N
sample_size = 100       # size of the sample taken, n
sample_hits = 2         # number matching in the sample, k

estimated_count = Fraction(population * sample_hits, sample_size)
approx_count = int(estimated_count + Fraction(1, 2))
print(f"Estimated count (fraction): {estimated_count}")
print(f"Estimated count (rounded): about {approx_count}")
How to write it in LaTeX and other math languages (copy and paste)
x = m × n ÷ k
x = \dfrac{m \times n}{k}
<math xmlns="http://www.w3.org/1998/Math/MathML" display="block">
<mrow>
<mi>x</mi>
<mo>=</mo>
<mfrac>
<mrow><mi>m</mi><mo>×</mo><mi>n</mi></mrow>
<mi>k</mi>
</mfrac>
</mrow>
</math>
x = (m*n)/k
(m*n)/k
x := m*n/k;
x = m*n/k;
x = (m×n)/k
a : b = c : d ⇔ a × d = b × c
a : b = c : d \iff ad = bc
<math xmlns="http://www.w3.org/1998/Math/MathML" display="block">
<mrow>
<mi>a</mi><mo>:</mo><mi>b</mi>
<mo>=</mo>
<mi>c</mi><mo>:</mo><mi>d</mi>
<mo>⇔</mo>
<mi>a</mi><mi>d</mi>
<mo>=</mo>
<mi>b</mi><mi>c</mi>
</mrow>
</math>
a : b = c : d <=> a*d = b*c
a*d == b*c
a*d = b*c;
a*d == b*c
a : b = c : d ⇔ a×d = b×c
x = N × k ÷ n
x = \dfrac{N \times k}{n}
<math xmlns="http://www.w3.org/1998/Math/MathML" display="block">
<mrow>
<mi>x</mi>
<mo>=</mo>
<mfrac>
<mrow><mi>N</mi><mo>×</mo><mi>k</mi></mrow>
<mi>n</mi>
</mfrac>
</mrow>
</math>
x = (N*k)/n
(N*k)/n
x := N*k/n;
x = N*k/n;
x = (N×k)/n
How to have ChatGPT do the calculation
You are a math calculation assistant (middle school sampling). Do the following calculation by actually running Python code, and base your answer only on the numbers from the execution result (do not answer by mental math or guessing).

Estimate the total number of fish in a pond with the capture-recapture method.
First, 50 fish were caught, marked and put back in the pond. Later, 30 fish were caught, and 6 of them were marked.
Show each of the following:
1. The proportion with x as the total (x : number marked = number in the 2nd catch : number marked in it)
2. The steps to solve it with "the product of the means equals the product of the extremes"
3. The estimated total in the pond (if the division does not come out even, give both the fraction in lowest terms and the number rounded to the nearest whole number)

In Python, calculate exactly with the fractions module from the standard library, and show the formulas you used and the numbers from the execution result.
How to Use
-
1Enter your numbersType the numbers you want to calculate with into the input fields
-
2CalculatePress the "Calculate" button
-
3Check the resultThe result appears on the spot. The same page also explains the idea behind the calculation and the formula
DataChef Features

No technical knowledge required.
Intuitive and user-friendly operation.

Can be used without registering personal information.

Automatic file deletion by clicking "download".

and rapid file conversion.

No attribution required.

No need to contact us for commercial use permission.
Related Features
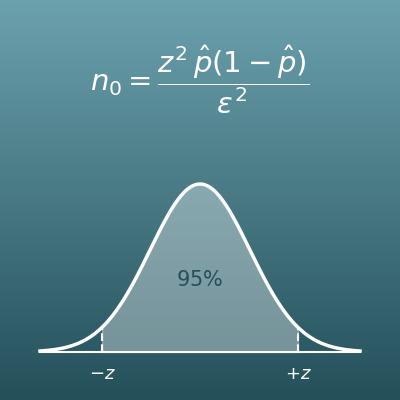
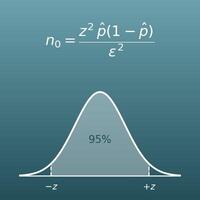
Sample Size Calculator (Surveys and Margin of Error)
Find the sample size you need to keep a survey's error within a limit. It is for planning a survey before you take the sample (this page estimates the population from a sample you already took)
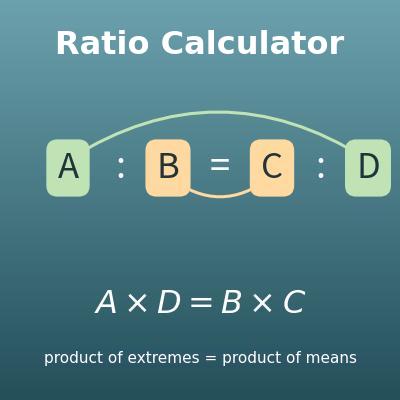
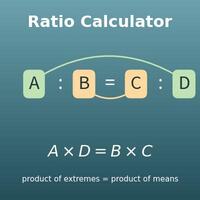
Ratio and Proportion Calculator (Solve A:B = C:D, Scale a Ratio)
Solve for the unknown x in a proportion a : b = x : c (cross products) or simplify a ratio, step by step
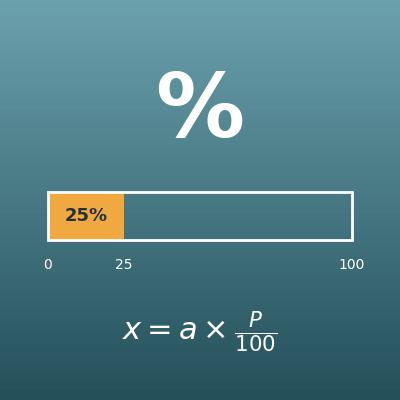
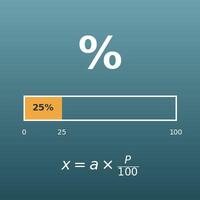
Percentage Calculator (Percent, Part and Whole)
Work with the whole, the part and the percent - enter any two to find the third
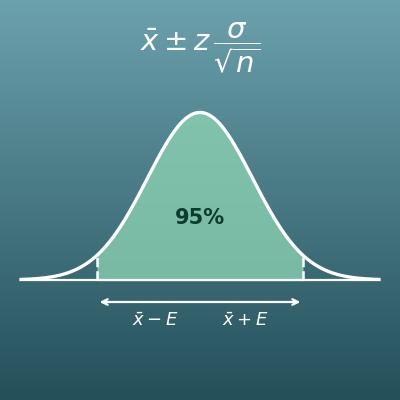
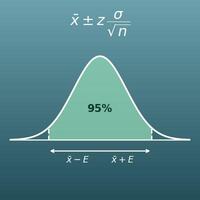
Confidence Interval Calculator for a Population Mean
Estimate the population mean from a sample mean as a range (an interval estimate). It takes the idea of estimating the whole from a sample on to high school and college statistics