Enter your data values separated by commas (,). The mean (arithmetic mean), median, mode and range are calculated together, along with the data sorted from smallest to largest.
Table of Contents
-
What you can do on this page
-
What is this calculation used for?
-
How to Use
-
Formula
-
Symbols and terms
-
Good to know before you start
-
How to calculate it in Excel
-
How to calculate it in Google Sheets
-
How to calculate it in Python
-
How to write it in LaTeX and other math languages (copy and paste)
-
How to have ChatGPT do the calculation
-
DataChef Features
-
Related Features
-
NumberChef Calculators List
What you can do on this page
- Enter numbers separated by commas (,) and get four measures at once: the mean (arithmetic mean), the median, the mode and the range
- The mode (the value that appears most often) is counted automatically. It also handles data with two or more modes (bimodal or multimodal) and data where every value appears once, so there is no mode
- The data sorted from smallest to largest, the maximum, the minimum, the sum and the count are shown too, so you can check the median and the range yourself
- A plain-language guide to "When should I use the mean, the median or the mode?" and copy-and-paste formulas for Excel, Google Sheets and Python are all on this page
What is this calculation used for?
Suppose a store sold 7 pairs of shoes in one day, in sizes 9, 9.5, 9, 10, 9.5, 9 and 11. The mean is about 9.6, but what the store should stock more of is the size that sells most, which is the mode: size 9 (3 pairs).
When you decide what to order or keep in stock based on "which one sells most", such as sizes, colors or models, the mode, not the mean, is the number that matters.
Suppose five households have savings of $30,000, $30,000, $40,000, $50,000 and $400,000. The mean is $110,000, but the median is $40,000 and the mode is $30,000.
For lopsided data such as savings or income, a few large values pull the mean up, so the median or the mode is closer to what a typical household has. That is why the US Census Bureau reports household income as both a median and a mean. Knowing the difference keeps you from being misled when you read about an "average" in the news.
In a vote on favorite school lunches by a class of 30 students, with pizza 12 votes, tacos 10 and chicken nuggets 8, the typical choice is the mode, "pizza". There is no way to calculate a mean or median of lunch menus.
The mode is the only measure of center you can use for data that is not numbers (categorical data). From product surveys to election results, it is one of the most used basics of summarizing data.
In factories, a few products are regularly pulled from the line and measured for size or weight, and the range (maximum − minimum) of each small sample is recorded and watched. This is called an R chart, and it is widely used (control charts are one of the seven basic tools of quality).
If the range suddenly gets wider, it is a sign that something is wrong, such as a loose machine part or uneven material. Because one subtraction shows the spread, it is used every day on the factory floor.
Even if the class average is 60 points, the class may be split into a group that did well (around 80) and a group that struggled (around 40), with almost no students near 60 (a bimodal distribution).
Instead of judging by the mean alone, also look at the mode, the median and the spread of the scores (the range). Then you can plan help that fits the real situation of the class.
Formula
Symbols and terms
Symbols
| \(x_1, x_2, \ldots, x_n\) | x sub 1, x sub 2, …, x sub n | The individual data values. (Example - the scores of 5 tests) |
| \(n\) | n | The number of values. (Example - for 5 tests, \(n = 5\)) |
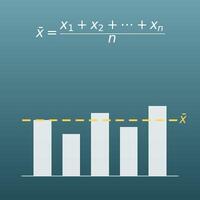
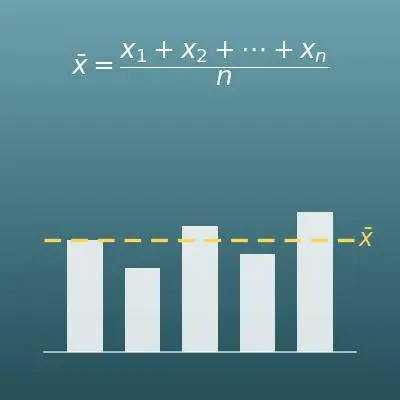
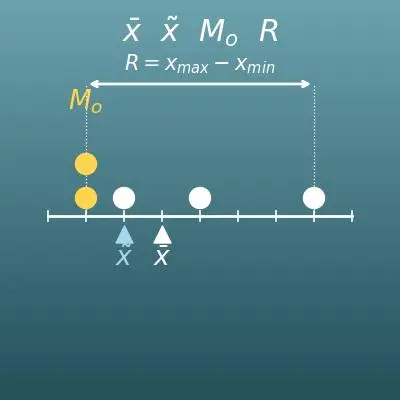
| \(\bar{x}\) | x-bar | The mean (arithmetic mean). A bar over the letter is the standard way to write a mean in statistics. The mean of a whole population is written \(\mu\) (mu) instead. |
| \(\tilde{x}\) | x-tilde | The median. Textbooks often just write the word "median" instead of a symbol, and some write it as M or Med. |
| \(M_o\) | M sub o (mode) | The mode, a short form of the word "mode". It is also written Mo. Textbooks usually just write the word instead of a symbol. |
| \(f(x)\) | f of x | How many times the value \(x\) appears in the data (its frequency). (Example - if 70 appears twice, \(f(70) = 2\)) |
| \(f_{\max}\) | f max | The largest frequency (the highest count). A mode is a value whose frequency equals this number. |
| \(x_{(k)}\) | x sub k in parentheses | The \(k\)th value when the data is sorted from smallest to largest. (Example - \(x_{(1)}\) is the minimum) |
| \(x_{\max},\ x_{\min}\) | x max, x min | The maximum and the minimum of the data. They are the inputs to the range formula. |
| \(R\) | R | The range, the maximum minus the minimum. It comes from the first letter of "range". |
Terms
| measure of center | A single number that sums up where the data is centered. The three main ones are the mean, the median and the mode. In US schools they are usually taught in Grade 6. |
| arithmetic mean | All the data added up and divided by the number of values. This is what people usually mean by "average". Because it uses every value, it is easily pulled by outliers. |
| median | The value exactly in the middle when the data is sorted from smallest to largest. With an even number of values, take the mean of the two middle values. It is a measure of center that outliers hardly affect. |
| mode | The value that appears most often in the data. If several values share the highest frequency, all of them are modes; if every value appears once, there is no mode. It is the only measure of center that also works for categorical data. |
| range | The maximum minus the minimum. It is the quickest measure of how spread out the data is. |
| frequency | How many times a value (or a class interval) appears in the data. The mode is the value with the highest frequency. |
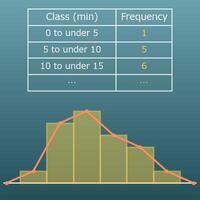
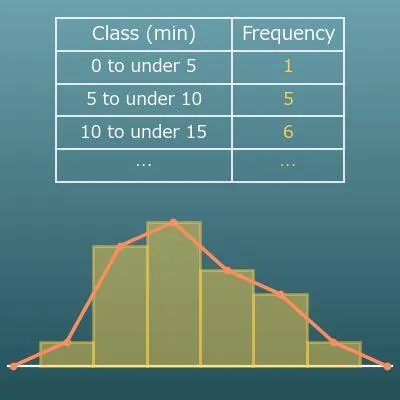
| frequency distribution table | A table that splits the data into ranges (class intervals) such as "60 to under 70" and counts the frequency of each. For finely spread data such as height, the mode is thought of as the class interval with the highest frequency. |
| class interval | In a frequency distribution table, one of the ranges such as "60 to under 70" that the data is split into (also called a class or a bin). The value in the middle of a class interval is its midpoint, and for finely spread data the mode is taken as the midpoint of the class interval with the highest frequency. |
| bimodal (multimodal) | When the distribution of the data has two (or more) peaks. Having more than one mode is a sign of this, and the data may be a mix of two groups with different characteristics. |
| outlier | A value that is extremely far from the other values. The mean and the range are pulled strongly by outliers, but the median and the mode are hardly affected. |
Good to know before you start
Here is what helps you use the calculation on this page with real understanding, not just by pressing the button.
| Addition, subtraction and division (Grades 3–4) |
|
| The mean (Grade 6) |
|
| Statistics and measures of center (Grade 6) |
|
| Frequency tables and histograms (Grade 6) |
|
How to calculate it in Excel
| Value 1 | 60 |
| Value 2 | 70 |
| Value 3 | 70 |
| Value 4 | 80 |
| Value 5 | 95 |
| Mode | =MODE.SNGL(B1:B5) |
| Value 1 | 60 |
| Value 2 | 70 |
| Value 3 | 70 |
| Value 4 | 80 |
| Value 5 | 95 |
| Sum | =SUM(B1:B5) |
| Count | =COUNT(B1:B5) |
| Mean (arithmetic mean) | =AVERAGE(B1:B5) |
| Value 1 | 60 |
| Value 2 | 70 |
| Value 3 | 70 |
| Value 4 | 80 |
| Value 5 | 95 |
| Median | =MEDIAN(B1:B5) |
| Value 1 | 60 |
| Value 2 | 70 |
| Value 3 | 70 |
| Value 4 | 80 |
| Value 5 | 95 |
| Maximum | =MAX(B1:B5) |
| Minimum | =MIN(B1:B5) |
| Range (max − min) | =B6-B7 |
The first table shows the mode 70 in B6. The second shows the sum 375 in B6, the count 5 in B7 and the mean 75 in B8. The third shows the median 70 in B6, and the fourth shows the range 35 in B8.
MODE.SNGL returns only the first mode when there are several. To get all of them, use "=MODE.MULT(B1:B5)" (the results spill into several cells). When every value appears once, you get the "#N/A" error, which means there is no mode.
To use a different number of values, add (or remove) rows of numbers, then change "B1:B5" in the formulas to your actual data range (for 7 values, B1:B7).
How to calculate it in Google Sheets
| Value 1 | 60 |
| Value 2 | 70 |
| Value 3 | 70 |
| Value 4 | 80 |
| Value 5 | 95 |
| Mode | =MODE(B1:B5) |
| Value 1 | 60 |
| Value 2 | 70 |
| Value 3 | 70 |
| Value 4 | 80 |
| Value 5 | 95 |
| Sum | =SUM(B1:B5) |
| Count | =COUNT(B1:B5) |
| Mean (arithmetic mean) | =AVERAGE(B1:B5) |
| Value 1 | 60 |
| Value 2 | 70 |
| Value 3 | 70 |
| Value 4 | 80 |
| Value 5 | 95 |
| Median | =MEDIAN(B1:B5) |
| Value 1 | 60 |
| Value 2 | 70 |
| Value 3 | 70 |
| Value 4 | 80 |
| Value 5 | 95 |
| Maximum | =MAX(B1:B5) |
| Minimum | =MIN(B1:B5) |
| Range (max − min) | =B6-B7 |
Copy the whole table, paste it into cell A1, and replace B1 to B5 with your own numbers.
How to calculate it in Python
import statistics

numbers = [10, 2, 38, 23, 38, 23, 21]  # the data to look at

mean_value = statistics.mean(numbers)        # mean (arithmetic mean)
median_value = statistics.median(numbers)    # median
mode_values = statistics.multimode(numbers)  # mode (a list with all modes if there are several)
value_range = max(numbers) - min(numbers)    # range (max - min)

print(f"Mean: {mean_value}")
print(f"Median: {median_value}")
print(f"Mode: {mode_values}")
print(f"Range: {value_range}")
print(f"Sorted: {sorted(numbers)}")
How to write it in LaTeX and other math languages (copy and paste)
Mo = x (f(x) = f_max)
M_o = x \quad \bigl(\, f(x) = f_{\max} \,\bigr)
<math xmlns="http://www.w3.org/1998/Math/MathML" display="block">
  <mrow>
    <msub><mi>M</mi><mi>o</mi></msub>
    <mo>=</mo>
    <mi>x</mi>
    <mspace width="1em"/>
    <mrow>
      <mo>(</mo>
      <mi>f</mi><mo>(</mo><mi>x</mi><mo>)</mo>
      <mo>=</mo>
      <msub><mi>f</mi><mi>max</mi></msub>
      <mo>)</mo>
    </mrow>
  </mrow>
</math>
M_o = x (f(x) = f_(max))
Commonest[{x1, x2, x3}]
Statistics:-Mode([x1, x2, x3]);
M = mode(x);
M_o = x (f(x) = f_max)
x̄ = (x₁ + x₂ + ⋯ + xₙ) ÷ n
\bar{x} = \frac{x_1 + x_2 + \cdots + x_n}{n} = \frac{1}{n}\sum_{i=1}^{n} x_i
<math xmlns="http://www.w3.org/1998/Math/MathML" display="block">
<mrow>
<mover accent="true"><mi>x</mi><mo>¯</mo></mover>
<mo>=</mo>
<mfrac>
<mrow>
<msub><mi>x</mi><mn>1</mn></msub>
<mo>+</mo>
<msub><mi>x</mi><mn>2</mn></msub>
<mo>+</mo>
<mo>⋯</mo>
<mo>+</mo>
<msub><mi>x</mi><mi>n</mi></msub>
</mrow>
<mi>n</mi>
</mfrac>
</mrow>
</math>
bar x = (x_1 + x_2 + cdots + x_n) / n
Mean[{x1, x2, x3}]
xbar := add(x[i], i = 1 .. n)/n;
xbar = mean(x);
x̄ = (x_1 + x_2 + ⋯ + x_n)/n
\tilde{x} = \begin{cases} x_{(\,(n+1)/2\,)} & (n:\ \mathrm{odd}) \\[6pt] \dfrac{x_{(n/2)} + x_{(n/2+1)}}{2} & (n:\ \mathrm{even}) \end{cases}
<math xmlns="http://www.w3.org/1998/Math/MathML" display="block">
<mrow>
<mover accent="true"><mi>x</mi><mo>~</mo></mover>
<mo>=</mo>
<mrow>
<mo>{</mo>
<mtable columnalign="center left">
<mtr>
<mtd><msub><mi>x</mi><mrow><mo>(</mo><mo>(</mo><mi>n</mi><mo>+</mo><mn>1</mn><mo>)</mo><mo>/</mo><mn>2</mn><mo>)</mo></mrow></msub></mtd>
<mtd><mrow><mo>(</mo><mi>n</mi><mo>:</mo><mtext>odd</mtext><mo>)</mo></mrow></mtd>
</mtr>
<mtr>
<mtd><mfrac>
<mrow>
<msub><mi>x</mi><mrow><mo>(</mo><mi>n</mi><mo>/</mo><mn>2</mn><mo>)</mo></mrow></msub>
<mo>+</mo>
<msub><mi>x</mi><mrow><mo>(</mo><mi>n</mi><mo>/</mo><mn>2</mn><mo>+</mo><mn>1</mn><mo>)</mo></mrow></msub>
</mrow>
<mn>2</mn>
</mfrac></mtd>
<mtd><mrow><mo>(</mo><mi>n</mi><mo>:</mo><mtext>even</mtext><mo>)</mo></mrow></mtd>
</mtr>
</mtable>
</mrow>
</mrow>
</math>
tilde x = {(x_(((n+1)/2)), if n odd), ((x_((n/2)) + x_((n/2+1)))/2, if n even):}
Median[{x1, x2, x3}]
Statistics:-Median([x1, x2, x3]);
med = median(x);
x̃ = (x_((n/2)) + x_((n/2+1)))/2 (for an even number of values; for an odd number, x̃ = x_(((n+1)/2)))
R = xₘₐₓ − xₘᵢₙ
R = x_{\max} - x_{\min}
<math xmlns="http://www.w3.org/1998/Math/MathML" display="block">
<mrow>
<mi>R</mi>
<mo>=</mo>
<msub><mi>x</mi><mi>max</mi></msub>
<mo>−</mo>
<msub><mi>x</mi><mi>min</mi></msub>
</mrow>
</math>
R = x_(max) - x_(min)
Max[{x1, x2, x3}] - Min[{x1, x2, x3}]
R := max(L) - min(L);
R = max(x) - min(x);
R = x_max − x_min
How to have ChatGPT do the calculation
You are a statistics calculation assistant. Do the following calculation by actually running Python code, and base your answer only on the numbers from the execution result (do not answer by mental math or guessing).

For the following data, find each of the values below.
Data: 10, 2, 38, 23, 38, 23, 21
1. The mean (arithmetic mean)
2. The median
3. The mode. If there are several, list all of them. If every value appears once, answer "no mode"
4. The range (maximum − minimum)
5. The data sorted from smallest to largest

Show the formulas you used and the numbers from the execution result.
How to Use
-
1Enter your numbersType the numbers you want to calculate with into the input fields
-
2CalculatePress the "Calculate" button
-
3Check the resultThe result appears on the spot. The same page also explains the idea behind the calculation and the formula
DataChef Features

No technical knowledge required.
Intuitive and user-friendly operation.

Can be used without registering personal information.

Automatic file deletion by clicking "download".

and rapid file conversion.

No attribution required.

No need to contact us for commercial use permission.
Related Features
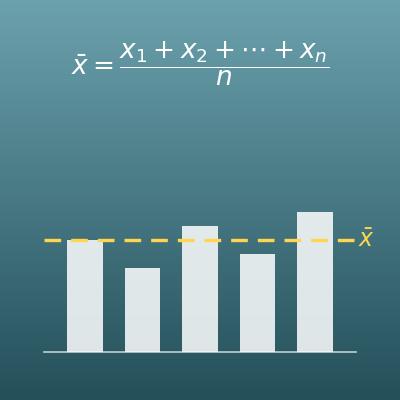
Average Calculator (Mean)
Calculates the average (arithmetic mean) along with the sum, count, geometric mean and more
Standard Deviation Calculator for Population and Sample
Calculates how spread out data is (standard deviation and variance) for both a population and a sample
Normal Distribution Probability Calculator
Find the probability of falling in a given range from the mean and standard deviation
Frequency Distribution Table Calculator (Relative and Cumulative Frequency, Histogram)
Builds a frequency distribution table from raw data, with relative and cumulative frequency, an estimated mean from class midpoints, a histogram and a frequency polygon