Enter the coefficient a and choose what to calculate (the mode). For the range of y or the average rate of change, enter the x-interval p and q. For the value of y, enter a value of x.
Table of Contents
-
What you can do on this page
-
What is this calculation used for?
-
How to Use
-
Formulas and graphs
-
Symbols and terms
-
Good to know before you start
-
How to calculate it in Excel
-
How to calculate it in Google Sheets
-
How to calculate it in Python
-
How to write it in LaTeX and other math languages (copy and paste)
-
How to have ChatGPT do the calculation
-
DataChef Features
-
Related Features
-
NumberChef Calculators List
What you can do on this page
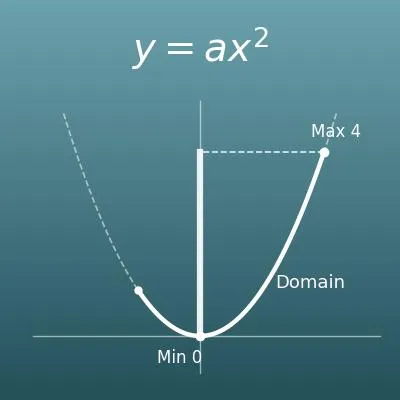
- For the quadratic function \(y = ax^{2}\), find the range of y for a domain of x, \(p \le x \le q\). The steps also explain the two cases, whether or not the domain includes 0 (when it does, the minimum or maximum is 0 at the vertex)
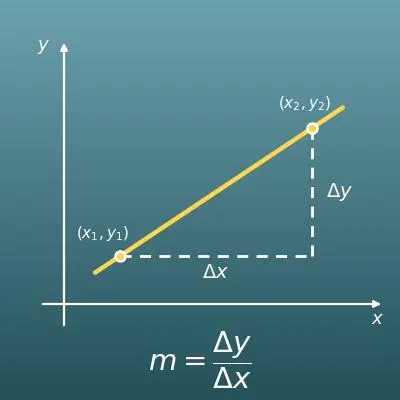
- Find the average rate of change as x goes from \(p\) to \(q\), both by the definition \(\dfrac{\Delta y}{\Delta x}\) (change in y ÷ change in x), with steps, and by the shortcut formula \(a(p+q)\)
- Find the value of y for a value of x (a point on the graph)
- The coefficient a can be a whole number, a decimal or a fraction such as 1/2
- The parabola is graphed. In range mode, the part for the domain and the range of y are highlighted; in rate-of-change mode, the line through the two points is drawn. A plain-language explanation of the formulas and copy-and-paste formulas for Excel, Google Sheets and Python are also on this page
What is this calculation used for?
If you ignore air resistance, a ball thrown at an angle follows a parabola (the graph of \(y = ax^{2}\), shifted to another place).
A fly ball in baseball, a basketball shot and the water from a fountain all follow this shape, and this function is used to simulate sports and to move balls in video games.
If you ignore air resistance, the distance a dropped object falls is directly proportional to the square of the time since it was let go. With distance in feet and time in seconds, the constant is about 16, giving the quadratic function \(y = 16x^{2}\).
About 16 feet in 1 second, about 64 feet in 2 seconds: doubling the time makes the distance four times as large. This law, discovered by Galileo, is the starting point for the motion calculations in physics.
The distance a car travels from the moment the brakes are applied until it stops (the braking distance) is known to be roughly proportional to the square of its speed. Double the speed, and the braking distance becomes about four times as long.
This square relationship is the mathematical reason why speeding is dangerous. It is taught in driver's education, and it is a use of this function that directly affects safety.
The shape you get by spinning a parabola around its axis (a paraboloid) has a special property: radio waves or light coming in parallel to the axis all meet at one point, the focus.
Satellite TV dishes and radio telescopes use this to collect weak radio waves. Flashlights and car headlights use it the other way around, to send light out in a straight beam.
The force of the wind pushing on an object (wind pressure) is roughly proportional to the square of the wind speed. Double the wind speed, and the force becomes about four times as strong. This is why damage rises so quickly when a hurricane's winds get just a little faster.
When designing buildings and bridges, engineers use this square relationship to estimate the wind pressure from the expected wind speed, and decide how strong the structure must be.
Formulas and graphs
Symbols and terms
Symbols
| \(a\) | a | The coefficient: the number multiplying \(x^{2}\). It decides which way the graph opens (up if \(a > 0\), down if \(a < 0\)) and how narrow it is. By custom, letters near the start of the alphabet, \(a,\ b,\ c\), stand for fixed numbers. |
| \(x,\ y\) | ex, why | Variables: letters for numbers that can take many values. By custom, letters near the end of the alphabet, \(x,\ y,\ z\), stand for unknown or changing numbers. On this page, choosing \(x\) determines \(y\). |
| \(p,\ q\) | pee, cue | The two ends of the x-interval: the left and right ends of the domain in range mode, and the starting and ending values of x in rate-of-change mode. On this page, \(p < q\) always (p is the smaller one). |
| \(m\) | em | A letter used on this page to explain the range: whichever end of the domain, \(p\) or \(q\), is farther from \(0\) (the one with the larger absolute value). The maximum (the minimum if \(a < 0\)) is reached at this end. When the two ends have the same absolute value, both ends give the same value. |
| \(\Delta x,\ \Delta y\) | delta x, delta y | The change in x and the change in y. \(\Delta\) (delta) is the Greek letter for D, the first letter of "difference", and it stands for "value after the change − value before". |
| \(\le\) | is less than or equal to | An inequality sign that includes the end value. \(-1 \le x \le 3\) says "x is greater than or equal to −1 and less than or equal to 3", so both −1 and 3 are included. Some countries write it with two lines, \(\leqq\), with the same meaning. |
| \(x^{2}\) | x squared | \(x\) multiplied by itself (\(x^{2} = x \times x\)). The small 2 at the upper right (the exponent) tells how many times \(x\) is used as a factor. To square a negative number, use parentheses, as in \(\left(-3\right)^{2} = 9\). |
Terms
| function | When each value of x gives exactly one value of y, we say "y is a function of x". \(y = ax^{2}\) is a function too: choose x, and exactly one y is determined. |
| quadratic function | A function where y is given by a degree-2 expression in x. The simplest form is \(y = ax^{2}\), with its vertex at the origin; the general form \(y = ax^{2} + bx + c\) lets the vertex move away from the origin. |
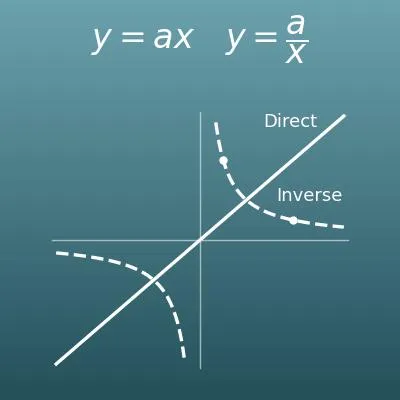
| coefficient | The number multiplying a variable, such as the \(a\) in \(y = ax^{2}\). Because \(y = ax^{2}\) says "y varies directly with the square of x", this \(a\) is also called the constant of variation, just as in direct variation \(y = ax\). |
| parabola | The smooth, symmetric curve that is the graph of \(y = ax^{2}\). It has the same shape as the path of an object thrown at an angle. |
| vertex | The turning point of a parabola. The vertex of \(y = ax^{2}\) is the origin (0, 0); it is the lowest point of the graph if \(a > 0\) and the highest point if \(a < 0\). |
| origin | The center of the coordinate plane, the point (0, 0), where the x-axis and the y-axis cross. It is labeled \(O\), the first letter of "origin". |
| domain and range | The set of values a variable can take, written with inequalities such as \(-1 \le x \le 3\). The domain is the set of values of x; the range is the set of values y takes over that domain. |
| average rate of change | The change in y divided by the change in x (\(\Delta y \div \Delta x\)). It tells how much y increases, on average, each time x increases by 1. It is constant for a linear function (the slope a), but for a quadratic function it depends on the interval. |
| change in x, change in y | The amount of change, found as "value after − value before". If the value goes down, the change is negative (for example, going from 18 to 2 is a change of −16). |
| opens upward | When \(a > 0\), the parabola has a valley shape. This is also called concave up. |
| opens downward | When \(a < 0\), the parabola has a hill shape. This is also called concave down. |
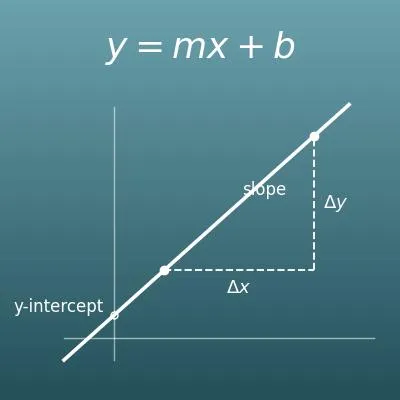
| linear function | A function of the form \(y = ax + b\) (its graph is a straight line). Its biggest difference from a quadratic function is that its rate of change is the same everywhere. |
Good to know before you start
Here is what helps you use the calculation on this page with real understanding, not just by pressing the button.
If you get stuck, going back over these topics is the fastest way forward.
| Positive and negative numbers (Grade 7) |
|
| Direct variation (Grade 7) |
|
| Coordinates and graphs (Grades 6–7) |
|
| Inequalities and intervals (Grades 6–8) |
|
| Linear functions and rate of change (Grade 8) |
|
How to calculate it in Excel
| Coefficient a | 2 |
| Left end of the domain p | -1 |
| Right end of the domain q | 3 |
| y at the left end | =B1*B2^2 |
| y at the right end | =B1*B3^2 |
| Minimum of y | =IF(AND(B2<=0,B3>=0),MIN(0,B4,B5),MIN(B4,B5)) |
| Maximum of y | =IF(AND(B2<=0,B3>=0),MAX(0,B4,B5),MAX(B4,B5)) |
| Coefficient a | 2 |
| Starting x (p) | 1 |
| Ending x (q) | 3 |
| Starting y | =B1*B2^2 |
| Ending y | =B1*B3^2 |
| Average rate of change (Δy÷Δx) | =(B5-B4)/(B3-B2) |
| Check with a(p+q) | =B1*(B2+B3) |
| Coefficient a | 2 |
| Value of x | 3 |
| Value of y | =B1*B2^2 |
The first table is y = 2x² with −1 ≤ x ≤ 3. The values of y at the left and right ends are 2 and 18, and the minimum 0 and maximum 18 are found (the range of y is 0 ≤ y ≤ 18). The IF(AND(B2<=0,B3>=0), …) part checks whether the domain includes 0; when it does, the 0 at the vertex is also a candidate for the minimum or maximum. It works as is when a is negative.
The second table is y = 2x² as x goes from 1 to 3. The definition cell (Δy÷Δx) and the shortcut cell a(p+q) both give 8.
The third table substitutes x = 3 into y = 2x², giving 18.
How to calculate it in Google Sheets
| Coefficient a | 2 |
| Left end of the domain p | -1 |
| Right end of the domain q | 3 |
| y at the left end | =B1*B2^2 |
| y at the right end | =B1*B3^2 |
| Minimum of y | =IF(AND(B2<=0,B3>=0),MIN(0,B4,B5),MIN(B4,B5)) |
| Maximum of y | =IF(AND(B2<=0,B3>=0),MAX(0,B4,B5),MAX(B4,B5)) |
| Coefficient a | 2 |
| Starting x (p) | 1 |
| Ending x (q) | 3 |
| Starting y | =B1*B2^2 |
| Ending y | =B1*B3^2 |
| Average rate of change (Δy÷Δx) | =(B5-B4)/(B3-B2) |
| Check with a(p+q) | =B1*(B2+B3) |
| Coefficient a | 2 |
| Value of x | 3 |
| Value of y | =B1*B2^2 |
How to calculate it in Python
from fractions import Fraction

coefficient_a = Fraction(2)   # coefficient a (a fraction such as 1/2 can be written Fraction(1, 2))
left_end = Fraction(-1)       # left end of the domain p (for the rate of change, the starting x)
right_end = Fraction(3)       # right end of the domain q (for the rate of change, the ending x)

y_left = coefficient_a * left_end ** 2
y_right = coefficient_a * right_end ** 2

# Range of y: split into cases by whether the domain includes 0 (the vertex)
if left_end <= 0 <= right_end:
    candidates = [Fraction(0), y_left, y_right]
else:
    candidates = [y_left, y_right]
y_min = min(candidates)
y_max = max(candidates)
print(f"Range of y: {y_min} <= y <= {y_max}")

# Average rate of change (as x goes from p to q)
rate = (y_right - y_left) / (right_end - left_end)
print(f"Average rate of change (definition Δy÷Δx): {rate}")
print(f"Average rate of change (shortcut a(p+q)): {coefficient_a * (left_end + right_end)}")
How to write it in LaTeX and other math languages (copy and paste)
y = ax²
y = ax^{2}
<math xmlns="http://www.w3.org/1998/Math/MathML" display="block">
  <mrow>
    <mi>y</mi>
    <mo>=</mo>
    <mi>a</mi>
    <msup><mi>x</mi><mn>2</mn></msup>
  </mrow>
</math>
y = a x^2
a x^2
y := a*x^2;
y = a*x^2;
y = ax^2
0 ≤ y ≤ am²
0 \le y \le am^{2}
<math xmlns="http://www.w3.org/1998/Math/MathML" display="block">
<mrow>
<mn>0</mn>
<mo>≤</mo>
<mi>y</mi>
<mo>≤</mo>
<mi>a</mi>
<msup><mi>m</mi><mn>2</mn></msup>
</mrow>
</math>
0 <= y <= a m^2
{MinValue[{a x^2, p <= x <= q}, x], MaxValue[{a x^2, p <= x <= q}, x]}
minimize(a*x^2, x = p .. q); maximize(a*x^2, x = p .. q);
m = max(abs(p), abs(q)); ymin = 0; ymax = a*m^2;
0 ≤ y ≤ am^2
Δy/Δx = (aq² − ap²)/(q − p)
\dfrac{\Delta y}{\Delta x} = \dfrac{aq^{2} - ap^{2}}{q - p}
<math xmlns="http://www.w3.org/1998/Math/MathML" display="block">
<mrow>
<mfrac>
<mrow><mi>Δ</mi><mi>y</mi></mrow>
<mrow><mi>Δ</mi><mi>x</mi></mrow>
</mfrac>
<mo>=</mo>
<mfrac>
<mrow>
<mi>a</mi><msup><mi>q</mi><mn>2</mn></msup>
<mo>−</mo>
<mi>a</mi><msup><mi>p</mi><mn>2</mn></msup>
</mrow>
<mrow><mi>q</mi><mo>−</mo><mi>p</mi></mrow>
</mfrac>
</mrow>
</math>
(Delta y)/(Delta x) = (a q^2 - a p^2)/(q - p)
(a q^2 - a p^2)/(q - p)
rate := (a*q^2 - a*p^2)/(q - p);
rate = (a*q^2 - a*p^2)/(q - p);
Δy/Δx = (aq^2 − ap^2)/(q − p)
Δy/Δx = a(p + q)
\dfrac{\Delta y}{\Delta x} = a(p + q)
<math xmlns="http://www.w3.org/1998/Math/MathML" display="block">
<mrow>
<mfrac>
<mrow><mi>Δ</mi><mi>y</mi></mrow>
<mrow><mi>Δ</mi><mi>x</mi></mrow>
</mfrac>
<mo>=</mo>
<mi>a</mi>
<mo>(</mo>
<mi>p</mi>
<mo>+</mo>
<mi>q</mi>
<mo>)</mo>
</mrow>
</math>
(Delta y)/(Delta x) = a(p + q)
a (p + q)
rate := a*(p + q);
rate = a*(p + q);
Δy/Δx = a(p + q)
How to have ChatGPT do the calculation
You are a math calculation assistant for functions. Do the following calculation by actually running Python code, and base your answer only on the numbers from the execution result (do not answer by mental math or guessing).

For the quadratic function y = 2x², find the following two things.
1. The range of y when the domain of x is −1 ≤ x ≤ 3 (also explain why it matters whether the domain includes 0)
2. The average rate of change as x goes from 1 to 3 (show the steps for change in y ÷ change in x, and also use the shortcut formula a(p+q))

In Python, use the fractions module from the standard library to calculate exactly. Show the formulas you used and the numbers from the execution result.
How to Use
-
1Enter your numbersType the numbers you want to calculate with into the input fields
-
2CalculatePress the "Calculate" button
-
3Check the resultThe result appears on the spot. The same page also explains the idea behind the calculation and the formula
DataChef Features

No technical knowledge required.
Intuitive and user-friendly operation.

Can be used without registering personal information.

Automatic file deletion by clicking "download".

and rapid file conversion.
No attribution required.

No need to contact us for commercial use permission.
Related Features
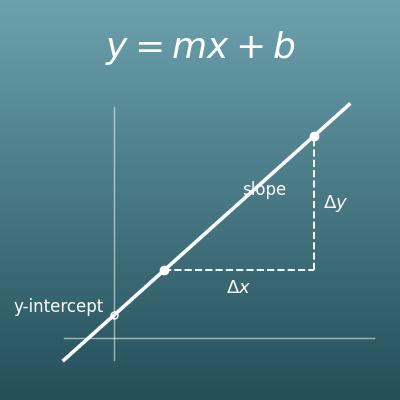
Linear Function Calculator (Find y = mx + b from Two Points or a Slope and a Point, Rate of Change and Intercepts)
Finds a linear function y=ax+b, its rate of change and where lines cross, with steps and a graph. Its rate of change is constant, unlike a quadratic function
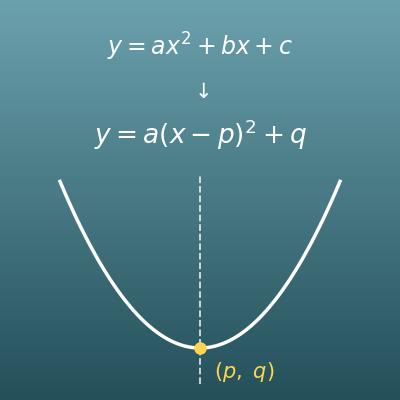
Completing the Square Calculator (Vertex, Axis of Symmetry, Max and Min)
Completes the square for the general form y=ax²+bx+c and finds the vertex, the axis and the maximum or minimum, with steps and a graph
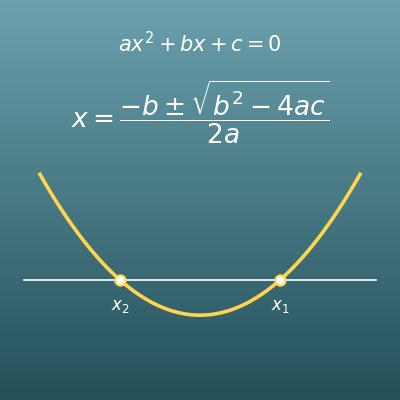
Quadratic Formula Calculator (Discriminant and Complex Roots)
Enter a, b and c to solve a quadratic equation, with the discriminant and steps