






























































































































Break-Even Point Calculator (Break-Even Sales and Units, Margin of Safety, Sales for a Target Profit)
Enter your fixed costs and your price and variable cost per unit, then press "Calculate" to get the contribution margin ratio, break-even sales and break-even units. For a business without a set unit price (such as contract work or services), choose "Variable cost ratio (%)". Actual sales and target profit can be left blank.
Table of Contents
-
What you can do on this page
-
What is this calculation used for?
-
How to Use
-
Formulas and figures
-
Symbols and terms
-
Good to know before you start
-
How to calculate it in Excel
-
How to calculate it in Google Sheets
-
How to calculate it in Python
-
How to write it in LaTeX and other math languages (copy and paste)
-
How to have ChatGPT do the calculation
-
DataChef Features
-
Related Features
-
NumberChef Calculators List
What you can do on this page
- From your fixed costs and your price and variable cost per unit (or variable cost ratio), get the contribution margin ratio, break-even sales and break-even units (rounded up)
- It answers planning questions such as "My fixed costs are $12,000 a month and a $5 cup of coffee has $1.50 in variable costs. How many cups a month do I need to sell to avoid a loss?"
- Enter your actual sales to get the margin of safety ratio (how far sales can fall before you make a loss), the break-even ratio and your profit
- Enter a target profit to work back to the sales and units you need to earn it
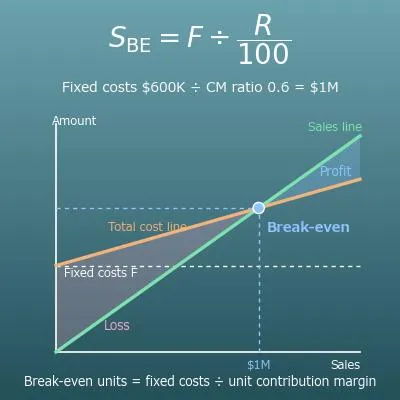
- A break-even chart shows at a glance where the sales line crosses the total cost line (fixed + variable costs): the break-even point. An explanation of the formulas and copy-and-paste formulas for Excel, Google Sheets and Python are also on this page
What is this calculation used for?
Say your fixed costs, such as rent, staff and basic utility charges, are $12,000 a month, and a cup of coffee sells for $5 with $1.50 in variable costs (beans, cups and so on). The contribution margin per cup is $3.50, so the break-even units are \(12{,}000 \div 3.5 \approx 3428.6\), rounded up to 3,429 cups. Open 30 days a month, that is about 115 cups a day, and the break-even sales are \(12{,}000 \div 0.7 \approx 17{,}143\) dollars.
The biggest benefit of this calculation is checking with numbers, before you open, whether 115 cups a day is realistic. If it does not fit your seats and opening hours, you can act in advance - look for cheaper rent, raise your price or cut variable costs - instead of finding out after you open.
Say you do contract work with fixed costs of $2,000 a month (software, phone and internet, your share of home rent) and variable costs of 20% of sales (outsourcing, payment fees and so on). The contribution margin ratio is 80%, so the break-even sales are \(2{,}000 \div 0.8 = 2{,}500\) dollars.
If you also want $6,000 a month left over to live on, the sales needed for that target profit are \((2{,}000 + 6{,}000) \div 0.8 = 10{,}000\) dollars. Even when every job has a different price, knowing your variable cost ratio shows the monthly sales you need, and that is the basis for setting goals for your rates and number of jobs.
If a company with $5 million in annual sales has break-even sales of $4 million, its margin of safety ratio is \((5 - 4) \div 5 \times 100 = 20\)% and its break-even ratio is 80%. So if sales fell by 20%, profit would be zero.
How far can the business hold out if a downturn or the loss of a customer cuts sales? Should it lower its break-even point by cutting fixed costs (rent, payroll)? The margin of safety ratio is a yardstick for these decisions, and lenders and business advisors also use it to judge how safe a company is.
A product priced at $1,000 with a $400 variable cost and $600,000 of fixed costs has break-even units of 1,000. If you cut the price by 10% to $900 to attract customers, the contribution margin per unit drops from $600 to $500, so the break-even units become \(600{,}000 \div 500 = 1200\).
"A 10% price cut calls for 20% more units just to avoid a loss" shows that the smaller a product's contribution margin, the bigger the effect of a price cut. Use it before cutting prices to check whether you can really sell that many more units.
Say a product sells for $800 with a $500 variable cost, and a customer offers an extra order at a lower price of $650. If the full cost per unit, including fixed costs, is $700, then "$650 loses money" at first sight. But if you have spare equipment and staff and the order adds no fixed costs, each unit still earns a positive contribution margin of \(650 - 500 = 150\) dollars, and every unit you take helps cover fixed costs and adds to profit.
This thinking only works when the fixed costs are already being paid (you have spare capacity and the order does not drag down your existing prices). It is the textbook example of a decision based on the contribution margin in managerial accounting.
Formulas and figures
Symbols and terms
Symbols
| \(F\) | F | Fixed costs: the total of the costs you pay even with zero sales. \(F\) stands for fixed. (Example - if rent, salaries and so on add up to $600,000 a year, \(F = 600{,}000\)) |
| \(P\) | P | The selling price of one unit (one cup, one job). \(P\) stands for price. |
| \(V\) | V | The variable cost per unit: the cost each unit sold adds. \(V\) stands for variable. |
| \(m\) | m | The contribution margin per unit, found with \(m = P - V\). \(m\) stands for margin. It is lowercase to keep it apart from the contribution margin ratio \(R\). |
| \(R\) | R | The contribution margin ratio (%): the share of sales that goes toward fixed costs and profit. It is found with \(R = m \div P \times 100\), or as \(100 -\) the variable cost ratio. \(R\) stands for ratio. |
| \(S\) | S | Actual sales: your current or expected sales. \(S\) stands for sales. |
| \(S_{\mathrm{BE}}\) | S sub B-E | Break-even sales. The subscript BE is short for break-even. It is found with \(S_{\mathrm{BE}} = F \div (R \div 100)\). |
| \(Q_{\mathrm{BE}}\) | Q sub B-E | Break-even units. \(Q\) stands for quantity. It is \(Q_{\mathrm{BE}} = F \div m\) rounded up to a whole number. |
| \(M_{\mathrm{S}}\) | M sub S | The margin of safety ratio (%). The letters come from margin of safety. It is found with \(M_{\mathrm{S}} = (S - S_{\mathrm{BE}}) \div S \times 100\). |
| \(T\) | T | Target profit: the profit you want left after paying fixed costs. \(T\) stands for target. |
| \(S_{\mathrm{T}}\) | S sub T | The sales needed for the target profit \(T\), found with \(S_{\mathrm{T}} = (F + T) \div (R \div 100)\). |
Terms
| break-even point (BEP) | The point where sales exactly equal total costs (fixed + variable costs), so profit is zero. Sell more and you make a profit; sell less and you make a loss. Given in dollars it is the break-even sales, and given in units it is the break-even units. |
| fixed costs | Costs that stay the same whether sales (production or units sold) go up or down, such as rent, salaried staff, depreciation, insurance and lease payments. You pay them even in a month with zero sales, so on a break-even chart they are a flat line. |
| variable costs | Costs that rise in step with sales (production or units sold), such as materials, cost of goods, packaging, sales commissions and outsourcing. The amount per unit sold is the "variable cost per unit", and the share of sales is the "variable cost ratio". |
| contribution margin | Sales minus variable costs. It shows how much each sale contributes toward covering fixed costs, hence the name. (Some textbooks separate a "segment margin", which also takes out the fixed costs that belong only to that product.) The break-even point is where the total contribution margin equals the fixed costs. |
| contribution margin ratio | The contribution margin as a percentage of sales. It shows how much of each sales dollar goes toward fixed costs and profit, and it adds up to 100% with the variable cost ratio. It is the key ratio in this calculation, in the form break-even sales = fixed costs ÷ contribution margin ratio. |
| variable cost ratio | Variable costs as a percentage of sales, found with variable costs ÷ sales × 100. Even in a business without a set price, it is easy to know, as in "40% of sales goes to purchases and outsourcing", so this page has a mode for entering it. |
| break-even sales | The sales at which profit is exactly zero, found with fixed costs ÷ contribution margin ratio (as a decimal). It is the "sell at least this much or you lose money" line used in business plans and in deciding whether to start a business. |
| break-even units | The number of units sold at which profit is exactly zero, found with fixed costs ÷ contribution margin per unit and rounded up if it does not divide evenly (without rounding up, you fall just short of the fixed costs and still make a loss). |
| margin of safety ratio | How far actual sales are above break-even sales, as a percentage, found with (actual sales − break-even sales) ÷ actual sales × 100. It is a safety measure for a business that shows how many percent sales can fall before you make a loss. |
| break-even ratio | Break-even sales as a percentage of actual sales, found with break-even sales ÷ actual sales × 100. It adds up to 100% with the margin of safety ratio. The lower it is, the better the business holds up when sales fall. |
| sales for a target profit | The sales needed to earn the profit you are aiming for, found with (fixed costs + target profit) ÷ contribution margin ratio (as a decimal). It is the break-even sales formula with the target profit added to the fixed costs. |
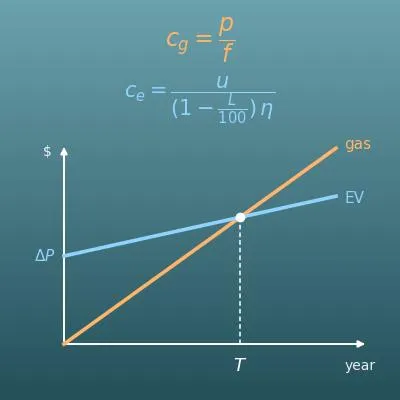
| total costs | Fixed costs plus variable costs. On a break-even chart, it is a straight line (the total cost line) that starts at the height of the fixed costs and rises with the units sold. The point where it crosses the sales line is the break-even point. |
| gross profit | Sales minus the cost of goods sold (purchase or production cost). It is similar to the contribution margin, but gross profit takes out the cost of goods, while the contribution margin takes out every cost that rises with sales (including sales commissions as well as the cost of goods). In manufacturing, where the cost of goods includes fixed costs such as factory depreciation, gross profit and contribution margin are not the same. |
| CVP analysis (cost-volume-profit analysis) | A managerial accounting method that studies how costs, sales or volume, and profit relate. Every calculation on this page is a basic CVP formula. It is a standard topic in managerial accounting courses and on the CMA exam. |
| separating fixed and variable costs | Splitting your actual costs into fixed costs and variable costs. It is the preparation step before calculating a break-even point. In practice, the usual way is to go through each cost account and ask whether it rises with sales (account analysis). |
Good to know before you start
Here is what helps you use the calculation on this page with real understanding, not just by pressing the button.
| Percents (Grade 6) |
|
| The percent equation (Grades 6–7) |
|
| Unit rates (Grade 6) |
|
| Division and rounding up (Grades 4–5) |
|
| Expressions and rearranging equations (Grades 7–8) |
|
| Graphs of linear functions and where they cross (Grade 8) |
|
How to calculate it in Excel
| Selling price P | 1000 |
| Variable cost per unit V | 400 |
| Contribution margin per unit m | =B1-B2 |
| Contribution margin per unit m | 600 |
| Selling price P | 1000 |
| Contribution margin ratio R (%) | =B1/B2*100 |
| Fixed costs F | 600000 |
| Contribution margin ratio R (%) | 60 |
| Break-even sales S_BE | =B1/(B2/100) |
| Fixed costs F | 600000 |
| Contribution margin per unit m | 600 |
| Break-even units Q_BE (rounded up) | =ROUNDUP(B1/B2,0) |
| Actual sales S | 1250000 |
| Break-even sales S_BE | 1000000 |
| Margin of safety ratio M_S (%) | =(B1-B2)/B1*100 |
| Fixed costs F | 600000 |
| Target profit T | 300000 |
| Contribution margin ratio R (%) | 60 |
| Sales for target profit S_T | =(B1+B2)/(B3/100) |
For example, the first table shows 600 in B3 (a contribution margin of $600 per unit), the second shows 60 in B3 (a contribution margin ratio of 60%), the third shows 1000000 in B3 (break-even sales of $1,000,000), the fourth shows 1000 in B3 (1,000 units), the fifth shows 20 in B3 (a margin of safety ratio of 20%) and the sixth shows 1500000 in B4 ($1,500,000).
The ROUNDUP function in the fourth table rounds up (units are whole numbers, and being even one unit short still leaves a loss). Just replace the inputs with your own numbers.
How to calculate it in Google Sheets
| Selling price P | 1000 |
| Variable cost per unit V | 400 |
| Contribution margin per unit m | =B1-B2 |
| Contribution margin per unit m | 600 |
| Selling price P | 1000 |
| Contribution margin ratio R (%) | =B1/B2*100 |
| Fixed costs F | 600000 |
| Contribution margin ratio R (%) | 60 |
| Break-even sales S_BE | =B1/(B2/100) |
| Fixed costs F | 600000 |
| Contribution margin per unit m | 600 |
| Break-even units Q_BE (rounded up) | =ROUNDUP(B1/B2,0) |
| Actual sales S | 1250000 |
| Break-even sales S_BE | 1000000 |
| Margin of safety ratio M_S (%) | =(B1-B2)/B1*100 |
| Fixed costs F | 600000 |
| Target profit T | 300000 |
| Contribution margin ratio R (%) | 60 |
| Sales for target profit S_T | =(B1+B2)/(B3/100) |
How to calculate it in Python
import math

fixed_cost = 600000     # fixed costs ($)
price = 1000            # selling price ($ per unit)
variable_cost = 400     # variable cost per unit ($ per unit)
actual_sales = 1250000  # actual sales ($)
target_profit = 300000  # target profit ($)

unit_contribution = price - variable_cost                    # contribution margin per unit
cm_ratio = unit_contribution / price * 100                    # contribution margin ratio (%)
bep_sales = fixed_cost / (cm_ratio / 100)                     # break-even sales
bep_units = math.ceil(fixed_cost / unit_contribution)         # break-even units (rounded up)

safety_margin_rate = (actual_sales - bep_sales) / actual_sales * 100   # margin of safety ratio (%)
bep_ratio = bep_sales / actual_sales * 100                              # break-even ratio (%)
profit = actual_sales * (cm_ratio / 100) - fixed_cost                   # profit

target_sales = (fixed_cost + target_profit) / (cm_ratio / 100)          # sales for target profit
target_units = math.ceil((fixed_cost + target_profit) / unit_contribution)

print(f"Contribution margin per unit: ${unit_contribution}")
print(f"Contribution margin ratio: {cm_ratio}%")
print(f"Break-even sales: ${bep_sales}")
print(f"Break-even units: {bep_units}")
print(f"Margin of safety ratio: {safety_margin_rate}% (break-even ratio {bep_ratio}%)")
print(f"Profit: ${profit}")
print(f"Sales needed for a target profit of ${target_profit}: ${target_sales} ({target_units} units)")
How to write it in LaTeX and other math languages (copy and paste)
m = P − V
m = P - V
<math xmlns="http://www.w3.org/1998/Math/MathML" display="block">
<mrow>
<mi>m</mi>
<mo>=</mo>
<mi>P</mi>
<mo>−</mo>
<mi>V</mi>
</mrow>
</math>
m = P - V
p - v
m := P - V;
m = P - V;
m = P - V
R = m ÷ P × 100
R = \dfrac{m}{P} \times 100
<math xmlns="http://www.w3.org/1998/Math/MathML" display="block">
<mrow>
<mi>R</mi>
<mo>=</mo>
<mfrac><mi>m</mi><mi>P</mi></mfrac>
<mo>×</mo>
<mn>100</mn>
</mrow>
</math>
R = m/P xx 100
m/p*100
R := m/P*100;
R = m/P*100;
R = m/P × 100
S_BE = F ÷ (R ÷ 100)
S_{\mathrm{BE}} = \dfrac{F}{R / 100}
<math xmlns="http://www.w3.org/1998/Math/MathML" display="block">
  <mrow>
    <msub><mi>S</mi><mi mathvariant="normal">BE</mi></msub>
    <mo>=</mo>
    <mfrac>
      <mi>F</mi>
      <mrow><mi>R</mi><mo>/</mo><mn>100</mn></mrow>
    </mfrac>
  </mrow>
</math>
S_(BE) = F/(R/100)
f/(r/100)
S_BE := F/(R/100);
S_BE = F/(R/100);
S_BE = F/(R/100)
Q_BE = F ÷ m
Q_{\mathrm{BE}} = \dfrac{F}{m}
<math xmlns="http://www.w3.org/1998/Math/MathML" display="block">
  <mrow>
    <msub><mi>Q</mi><mi mathvariant="normal">BE</mi></msub>
    <mo>=</mo>
    <mfrac><mi>F</mi><mi>m</mi></mfrac>
  </mrow>
</math>
Q_(BE) = F/m
Ceiling[f/m]
Q_BE := ceil(F/m);
Q_BE = ceil(F/m);
Q_BE = F/m
M_S = (S − S_BE) ÷ S × 100
M_{\mathrm{S}} = \dfrac{S - S_{\mathrm{BE}}}{S} \times 100
<math xmlns="http://www.w3.org/1998/Math/MathML" display="block">
<mrow>
<msub><mi>M</mi><mi mathvariant="normal">S</mi></msub>
<mo>=</mo>
<mfrac>
<mrow><mi>S</mi><mo>−</mo><msub><mi>S</mi><mi mathvariant="normal">BE</mi></msub></mrow>
<mi>S</mi>
</mfrac>
<mo>×</mo>
<mn>100</mn>
</mrow>
</math>
M_S = (S - S_(BE))/S xx 100
(s - sBE)/s*100
M_S := (S - S_BE)/S*100;
M_S = (S - S_BE)/S*100;
M_S = (S - S_BE)/S × 100
S_T = (F + T) ÷ (R ÷ 100)
S_{\mathrm{T}} = \dfrac{F + T}{R / 100}
<math xmlns="http://www.w3.org/1998/Math/MathML" display="block">
  <mrow>
    <msub><mi>S</mi><mi mathvariant="normal">T</mi></msub>
    <mo>=</mo>
    <mfrac>
      <mrow><mi>F</mi><mo>+</mo><mi>T</mi></mrow>
      <mrow><mi>R</mi><mo>/</mo><mn>100</mn></mrow>
    </mfrac>
  </mrow>
</math>
S_T = (F + T)/(R/100)
(f + t)/(r/100)
S_T := (F + T)/(R/100);
S_T = (F + T)/(R/100);
S_T = (F + T)/(R/100)
How to have ChatGPT do the calculation
You are an assistant for managerial accounting (break-even analysis). Do the following calculation by actually running Python code, and base your answer only on the numbers from the execution result (do not answer by mental math or guessing).

Fixed costs are $600,000 a year, the selling price of the product is $1,000, and the variable cost per unit is $400.
Find each of the following:
1. The contribution margin per unit (price − variable cost) and the contribution margin ratio (contribution margin ÷ price × 100, in %)
2. Break-even sales (fixed costs ÷ contribution margin ratio as a decimal)
3. Break-even units (fixed costs ÷ contribution margin per unit, rounded up to a whole number)
4. With actual sales of $1,250,000, the margin of safety ratio ((actual sales − break-even sales) ÷ actual sales × 100, in %) and the profit
5. The sales needed for a profit of $300,000 a year ((fixed costs + target profit) ÷ contribution margin ratio as a decimal) and the units needed (rounded up)

Show the formulas you used and the numbers from the execution result.
How to Use
-
1Enter your numbersType the numbers you want to calculate with into the input fields
-
2CalculatePress the "Calculate" button
-
3Check the resultThe result appears on the spot. The same page also explains the idea behind the calculation and the formula
DataChef Features

No technical knowledge required.
Intuitive and user-friendly operation.

Can be used without registering personal information.

Automatic file deletion by clicking "download".

and rapid file conversion.

No attribution required.

No need to contact us for commercial use permission.
Related Features
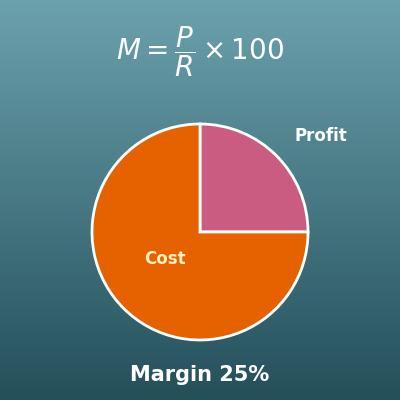
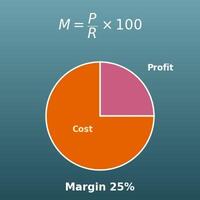
Profit Margin Calculator (Cost, Revenue, Profit and Markup)
Find cost, revenue, margin or profit from any two. Use it for the price and cost of one item; use this page to see how much you must sell to cover fixed costs too
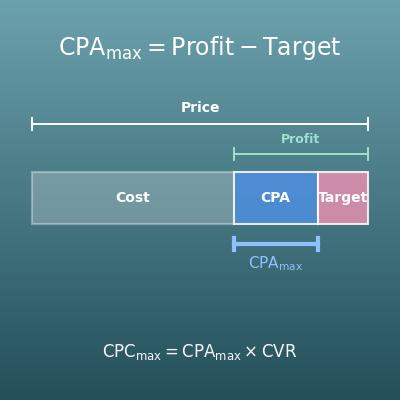
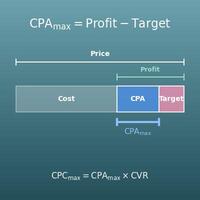
Break-Even CPA and Target CPA Calculator (Max Ad Spend per Conversion and Max CPC)
Find the most you can spend on ads per conversion (break-even CPA) from the average order value and gross margin. Use it for the break-even point of ad spend
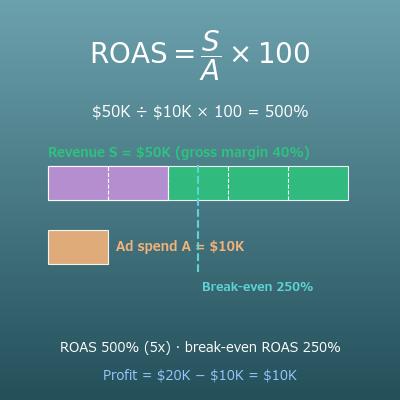
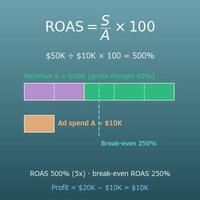
ROAS Calculator (Return on Ad Spend and Break-Even ROAS)
Find ROAS from revenue and ad spend, and the break-even ROAS from the gross margin. Use it to find the revenue multiple at which ads stop losing money
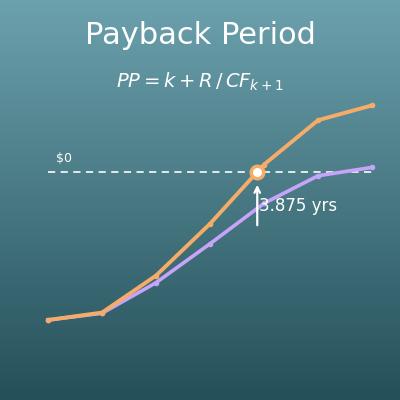
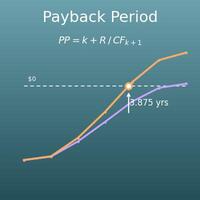
Payback Period Calculator (Simple and Discounted Payback)
Find how many years yearly cash flows take to pay back an initial investment. Use it for the break-even point in time rather than in dollars