


































































































































Enter as much of your income and spending as you know. You can choose monthly or yearly for each item. Blank items count as $0, so you do not have to fill in everything.
Table of Contents
-
What you can do on this page
-
What is this calculation used for?
-
How to Use
-
Formulas and figures
-
Symbols and terms
-
Good to know before you start
-
How to calculate it in Excel
-
How to calculate it in Google Sheets
-
How to calculate it in Python
-
How to write it in LaTeX and other math languages (copy and paste)
-
How to have ChatGPT do the calculation
-
DataChef Features
-
Related Features
-
NumberChef Calculators List
What you can do on this page
- Enter your income, such as wages, and your spending, such as housing, food and phone, as monthly or yearly amounts, and you instantly see your yearly and monthly gross income, take-home pay, total spending and balance (surplus or deficit)
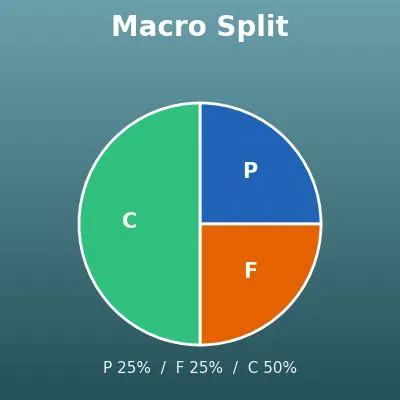
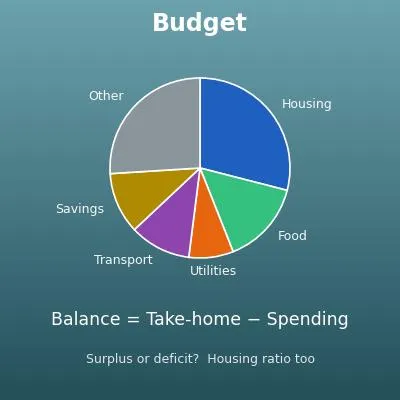
- Spending is grouped into 9 categories (housing, utilities, food and more), and a pie chart and a breakdown table show at a glance where your money goes
- It also shows your housing ratio (housing ÷ gross income) and your housing plus debt ratio, which adds loan payments, as percentages
- Take-home pay is estimated with a single "taxes and payroll deductions (%)" rate, so you can use it without knowing your exact taxes
- A plain-language explanation of the formulas, common US budgeting guidelines such as the 50/30/20 rule, and copy-and-paste formulas for Excel, Google Sheets and Python are all on this page
What is this calculation used for?
A common US guideline is to keep rent at or below about 30% of your gross income. If you earn $4,500 a month before taxes, that is about \(4{,}500 \times 0.3 = 1{,}350\) dollars. Many landlords also ask that your income be about 3 times the rent, which is the same idea.
This guideline is not a hard rule. In expensive cities, housing often takes more, and many people make up for it by spending less elsewhere. What matters is checking with the balance formula, before you sign, that you can stay in surplus at that rent. Rent is a fixed expense that you cannot easily change once you sign a lease.
The housing plus debt ratio on this page is the same idea lenders use when they approve a mortgage: the debt-to-income ratio (DTI). Under the common 28/36 rule, a gross income of $80,000 a year (about $6,667 a month) means housing of about \(6{,}667 \times 0.28 \approx 1{,}867\) dollars a month, and all debt payments including housing of about \(6{,}667 \times 0.36 \approx 2{,}400\) dollars a month. Car loans, student loans and credit card minimum payments all count toward the 36%.
But "the most a lender will approve" and "what you can comfortably repay" are different things. Borrowing up to the limit can squeeze your savings for college and retirement, so check your room to spare with your balance as well.
"Saving whatever is left over" often means nothing is left over. Instead, count your savings as spending first (for example, 20% of a $5,000 monthly take-home pay, \(5{,}000 \times 0.2 = 1{,}000\) dollars, as in the 50/30/20 rule) and use this page to check that your balance still stays in surplus. That is how you plan to pay yourself first.
If the balance goes negative, look through the breakdown table for other spending you can cut, rather than cutting the savings.
The salary in a job offer is gross income. For many employees, take-home pay is roughly 70 to 80% of gross, depending on taxes and deductions. A raise is taxed at your top (marginal) rates, so with federal, state and payroll taxes adding up to about 30% at the margin, a $5,000 raise means about \(5{,}000 \times (1 - 0.30) = 3{,}500\) dollars more to spend.
Knowing the take-home formula shows that "$5,000 more in salary" is not "$5,000 more to spend", so you can compare job offers and raises by how they really change your life. (Exact taxes depend on your income and deductions, so this is only an estimate.)
As the balance formula \(B = T - E\) shows, spending $100 less a month has the same effect as $100 more take-home pay a month: $1,200 a year. And cutting spending is usually more within your control than raising your income.
The standard approach is to start with the categories that take the largest share in the breakdown and with fixed expenses such as rent, phone plans, subscriptions and insurance. Cutting a fixed expense once keeps saving you money every month.
Formulas and figures
Symbols and terms
Symbols
| \(M\) | M | The monthly amount - what you pay (or receive) each month. (Example - rent of $1,200 a month) |
| \(A\) | A | The yearly amount - the amount for a full year. You can get it from the monthly amount with \(A = M \times 12\). |
| \(G\) | G | Gross income (yearly) - your total income before taxes and deductions, from the first letter of "gross". |
| \(r\) | small r | The rough rate of taxes and payroll deductions (%) - about how much of your gross income goes to taxes and payroll deductions. |
| \(T\) | T | Take-home pay (yearly) - your income after taxes and deductions, the money you can actually spend. |
| \(E\) | E | Total spending (yearly) - the total of all spending categories. On this page it includes money set aside for savings and investing. From the first letter of "expenses". |
| \(B\) | B | The balance (yearly) - what is left after subtracting total spending from take-home pay. Positive is a surplus, negative is a deficit. From the first letter of "balance". |
| \(H\) | H | Housing costs (yearly) - the total of rent or mortgage payments, HOA dues and maintenance, property tax, and homeowners or renters insurance. From the first letter of "housing". |
| \(R\) | capital R | The housing ratio (%) - housing costs as a share of gross income, from the first letter of "ratio". |
Terms
| gross income | Income before taxes and deductions. The salary in a job offer ("$60,000 a year") is usually gross income. |
| take-home pay | Income after federal and state income taxes, payroll taxes and other deductions are taken out - the money actually deposited in your account that you can spend. Economists call a similar amount "disposable income". |
| payroll taxes | Taxes taken from each paycheck for Social Security (6.2%) and Medicare (1.45%), often shown as FICA on a pay stub. Together with income taxes and deductions such as health insurance premiums, they make up most of the gap between gross and take-home pay. |
| pay yourself first | A way of saving where you set aside savings as soon as you are paid and live on what is left. It is said to work better than "saving whatever is left over", and this page follows the same idea by counting savings and investing as spending. Automatic transfers and 401(k) contributions from your paycheck are common ways to do it. |
| fixed expenses | Spending that stays about the same every month, such as rent, insurance and phone plans. Cutting one keeps saving you money every month, so budget reviews usually start with fixed expenses. |
| variable expenses | Spending that changes from month to month, such as groceries and entertainment. Unlike fixed expenses, saving on them takes effort every month, and the effect changes month by month. |
| debt-to-income ratio | Your monthly debt payments (including housing) divided by your gross monthly income, often shortened to DTI. Mortgage lenders really use it: the common 28/36 rule means housing at or below 28% and all debt payments at or below 36% of gross income, and car loans, student loans and credit card minimums all count. |
| 50/30/20 rule | A simple budgeting guideline widely used in the US - about 50% of take-home pay for needs (housing, utilities, groceries, insurance, minimum debt payments), 30% for wants (dining out, hobbies, travel) and 20% for savings and extra debt payoff. It is a starting point; in high-cost areas, needs often take more than 50%. |
Good to know before you start
Here is what helps you use the calculation on this page with real understanding, not just by pressing the button.
| Percents (Grades 6–7) |
|
| Large numbers and estimating (Grade 4) |
|
| Months and years |
|
| Positive and negative numbers (Grades 6–7) |
|
How to calculate it in Excel
| Monthly amount ($) | 1200 |
| Months in a year | 12 |
| Yearly amount ($) | =B1*B2 |
| Gross income ($ per year) | 80000 |
| Taxes and deductions (%) | 22 |
| Take-home pay ($ per year) | =B1*(100-B2)/100 |
| Take-home pay ($ per year) | 62400 |
| Total spending ($ per year) | 61300 |
| Balance ($ per year) | =B1-B2 |
| Housing costs ($ per year) | 17800 |
| Gross income ($ per year) | 80000 |
| Housing ratio (%) | =B1/B2*100 |
The first table shows 14,400 in B3 (a yearly rent of $1,200 a month), and the second shows 62,400 in B3 (take-home pay from $80,000 gross at 22%).
The third table is the balance: if B3 is positive, like 1,100, it is a surplus; if negative, a deficit. The fourth table is the housing ratio, and B3 shows 22.25 (%).
Just replace B1 and B2 with your own numbers.
How to calculate it in Google Sheets
| Monthly amount ($) | 1200 |
| Months in a year | 12 |
| Yearly amount ($) | =B1*B2 |
| Gross income ($ per year) | 80000 |
| Taxes and deductions (%) | 22 |
| Take-home pay ($ per year) | =B1*(100-B2)/100 |
| Take-home pay ($ per year) | 62400 |
| Total spending ($ per year) | 61300 |
| Balance ($ per year) | =B1-B2 |
| Housing costs ($ per year) | 17800 |
| Gross income ($ per year) | 80000 |
| Housing ratio (%) | =B1/B2*100 |
How to calculate it in Python
tax_rate = 22  # rough rate of taxes and payroll deductions (%)

# Income and spending: (amount, "m" = monthly or "y" = yearly)
incomes = {
    "Wages and salary": (6400, "m"),
    "Investment income": (1200, "y"),
    "Other income": (2000, "y"),
}
expenses = {
    "Housing (rent or mortgage, HOA)": (1250, "m"),
    "Property tax and home insurance": (2800, "y"),
    "Utilities and phone": (390, "m"),
    "Food": (800, "m"),
    "Transportation": (570, "m"),
    "Car insurance and registration": (1500, "y"),
    "Insurance and health care": (260, "m"),
    "Children and education": (300, "m"),
    "Debt payments": (200, "m"),
    "Savings and investing": (550, "m"),
    "Other": (330, "m"),
    "Travel": (1200, "y"),
}

def annual(amount, unit):
    # Monthly amounts are multiplied by 12 to put them on a yearly basis
    return amount * 12 if unit == "m" else amount

gross_income = sum(annual(a, u) for a, u in incomes.values())
net_income = gross_income * (100 - tax_rate) / 100
total_expenses = sum(annual(a, u) for a, u in expenses.values())
balance = net_income - total_expenses

print(f"Gross income: ${gross_income:,.0f} per year")
print(f"Take-home pay: ${net_income:,.0f} per year")
print(f"Total spending: ${total_expenses:,.0f} per year")
print(f"Balance: {balance:+,.0f} dollars per year")
How to write it in LaTeX and other math languages (copy and paste)
A = M × 12
A = M \times 12
<math xmlns="http://www.w3.org/1998/Math/MathML" display="block">
<mrow>
<mi>A</mi>
<mo>=</mo>
<mi>M</mi>
<mo>×</mo>
<mn>12</mn>
</mrow>
</math>
A = M xx 12
m*12
A := M*12;
A = M*12;
A = M × 12
T = G × (1 − r/100)
T = G \left(1 - \dfrac{r}{100}\right)
<math xmlns="http://www.w3.org/1998/Math/MathML" display="block">
<mrow>
<mi>T</mi>
<mo>=</mo>
<mi>G</mi>
<mo>×</mo>
<mrow>
<mo>(</mo>
<mn>1</mn>
<mo>−</mo>
<mfrac><mi>r</mi><mn>100</mn></mfrac>
<mo>)</mo>
</mrow>
</mrow>
</math>
T = G (1 - r/100)
g*(1 - r/100)
T := G*(1 - r/100);
T = G*(1 - r/100);
T = G(1 - r/100)
B = T − E
B = T - E
<math xmlns="http://www.w3.org/1998/Math/MathML" display="block">
<mrow>
<mi>B</mi>
<mo>=</mo>
<mi>T</mi>
<mo>−</mo>
<mi>E</mi>
</mrow>
</math>
B = T - E
t - ex
B := T - E;
B = T - E;
B = T − E
R = H ÷ G × 100
R = \dfrac{H}{G} \times 100
<math xmlns="http://www.w3.org/1998/Math/MathML" display="block">
<mrow>
<mi>R</mi>
<mo>=</mo>
<mfrac><mi>H</mi><mi>G</mi></mfrac>
<mo>×</mo>
<mn>100</mn>
</mrow>
</math>
R = H/G xx 100
h/g*100
R := H/G*100;
R = H/G*100;
R = H/G × 100
How to have ChatGPT do the calculation
You are a household budget calculation assistant. Do the following calculation by actually running Python code, and base your answer only on the numbers from the execution result (do not answer by mental math or guessing).

Here is my budget:
- Income (gross): wages $6,400 a month, investment income $1,200 a year, other income $2,000 a year
- Rough rate of taxes and payroll deductions: 22%
- Spending: housing (rent or mortgage, HOA) $1,250 a month, property tax and home insurance $2,800 a year, utilities and phone $390 a month, food $800 a month, transportation $570 a month, car insurance and registration $1,500 a year, insurance and health care $260 a month, children and education $300 a month, debt payments $200 a month, savings and investing $550 a month, other $330 a month, travel $1,200 a year

Multiply the monthly items by 12 to put everything on a yearly basis, then find each of the following:
1. Gross income (yearly) and take-home pay (yearly)
2. Total spending (yearly)
3. The balance (take-home pay − total spending, and whether it is a surplus or a deficit)
4. The housing ratio (yearly housing costs ÷ gross income × 100; housing is $1,250 a month plus $2,800 a year)

Show the formulas you used and the numbers from the execution result.
How to Use
-
1Enter your numbersType the numbers you want to calculate with into the input fields
-
2CalculatePress the "Calculate" button
-
3Check the resultThe result appears on the spot. The same page also explains the idea behind the calculation and the formula
DataChef Features

No technical knowledge required.
Intuitive and user-friendly operation.

Can be used without registering personal information.

Automatic file deletion by clicking "download".

and rapid file conversion.

No attribution required.

No need to contact us for commercial use permission.
Related Features
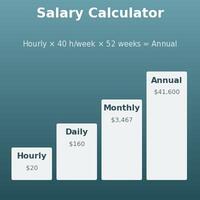
Salary Calculator (Hourly, Daily, Weekly, Monthly and Annual Pay)
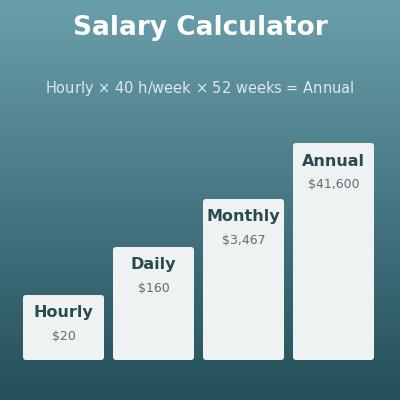
Convert between hourly, monthly and yearly pay. Handy for working out the monthly or yearly amounts to enter as income
Electricity Cost Calculator (Appliance Energy Use and Cost)
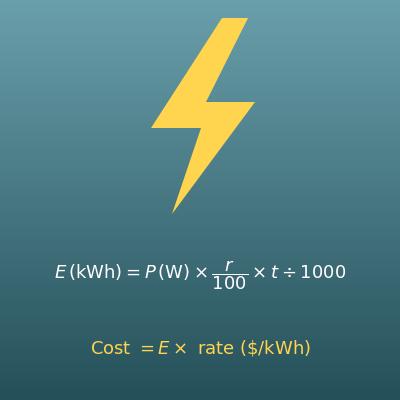
Calculate the electricity cost of an appliance from its wattage and hours of use. Useful for estimating your utility costs in detail
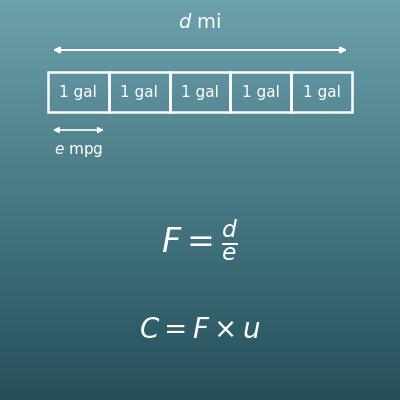
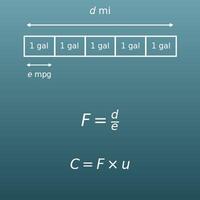
Gas Cost Calculator (Trip Fuel Cost from Distance, MPG and Gas Price)
Calculate the cost of gas from the distance, fuel economy and gas price. Useful for estimating your car expenses