










There are two ways to use this calculator. ① Enter the confidence level, proportion and margin of error to find the sample size you need. ② Enter the confidence level, proportion and sample size to find the margin of error. Enter the population size only if you know it.
Table of Contents
-
What you can do on this page
-
What is this calculation used for?
-
How to Use
-
Formula
-
Symbols and terms
-
Good to know before you start
-
How to calculate it in Excel
-
How to calculate it in Google Sheets
-
How to calculate it in Python
-
How to write it in LaTeX and other math languages (copy and paste)
-
How to have ChatGPT do the calculation
-
DataChef Features
-
Related Features
-
NumberChef Calculators List
What you can do on this page
- "How many people do I need to survey for a 95% confidence level and a ±5% margin of error?" Get the sample size your survey needs on the spot
- The other way around, "How accurate, plus or minus, is a survey of 1,000 people?" Find the margin of error on the same page
- If you know the size of the population (500 employees, 1,000 members, and so on), the finite population correction narrows it down to the number you really need
- A plain-language explanation of the formulas and copy-and-paste formulas for Excel, Google Sheets and Python are all on this page
What is this calculation used for?
National polls in the news usually survey about 1,000 to 2,000 randomly chosen people out of more than 200 million adults. At a 95% confidence level, a ±3% margin of error and a 50% proportion, the required sample size is \(1.96^2 \times 0.25 \div 0.03^2 \approx 1067.1\) (about 1,068 people). This formula answers the question, "Can about 1,000 people really tell us what hundreds of millions think?"
The other way around, you can see that if "45% versus 47% approval" is within a ±3-point margin of error, you cannot say for sure that there is a statistical difference.
"How many of our 1,000 members do we need to ask?" is a classic case for the finite population correction. At a 95% confidence level, a ±5% margin of error and a 50% proportion, the value before correction, 384.16, drops to \(384.16 \div (1 + 383.16 \div 1000) \approx 277.7\) (278 people after rounding up).
If you decide in advance how many responses are enough for the precision you need, before sending reminder after reminder to everyone, you can balance the cost and the precision of the survey with numbers.
This formula is also used to estimate the defect rate of mass-produced parts without inspecting every one. If past records suggest a defect rate of about 10%, a 90% confidence level and a ±4% margin of error give \(1.65^2 \times 0.1 \times 0.9 \div 0.04^2 \approx 153.1\), so a sample of about 154 parts is enough.
The example also shows that the farther the proportion is from 50%, the smaller the spread \(\hat{p}(1-\hat{p})\), and the fewer items you need.
In an epidemiological study of "the share of people in an area who have this condition", the study plan must state how many participants are needed. If earlier studies suggest a prevalence of about 20%, a 95% confidence level and a ±3% margin of error give \(1.96^2 \times 0.2 \times 0.8 \div 0.03^2 \approx 683.0\), about 683 people.
Real clinical research also uses more precise methods that fit the study design (such as power analysis). This formula is the basic form they start from.
TV ratings are estimated from a panel of sample households, not from every home. As a simplified example (real ratings methods are more complex), take a panel of 2,700 households and a show watched in 10% of them. At a 95% confidence level, the margin of error is \(1.96 \times \sqrt{0.1 \times 0.9 \div 2700} \approx 0.0113\) (about ±1.1%).
You can then see that "the gap between a 9.5% and a 10.5% rating may be within the margin of error", and read the numbers in the news one step deeper.
Formula
Symbols and terms
Symbols
| \(n\) | en | The sample size. For a survey, it is the number of people whose answers you collect; for an inspection, the number of items you check. |
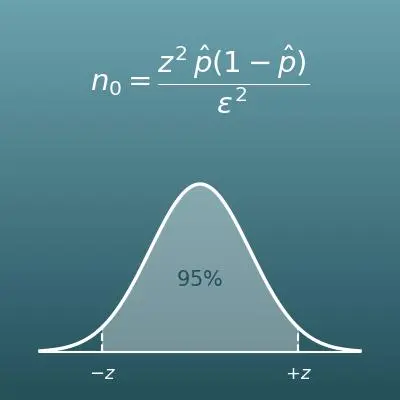
| \(n_0\) | n sub zero | The calculated required sample size when the population is treated as very large. It is the value before the finite population correction. |
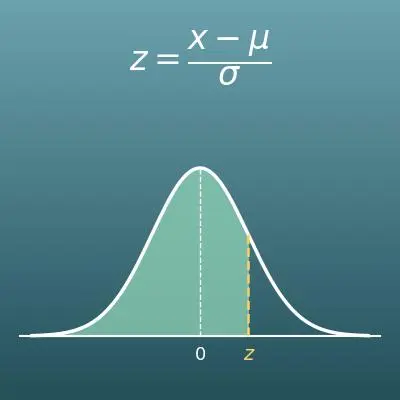
| \(z\) | zee | The z-score (a value on the standard normal distribution) for the confidence level. The customary values are 1.96 for 95% and 2.58 for 99%. |
| \(\hat{p}\) | p-hat | The proportion (such as the share of "yes" answers you want to know). To find the sample size, use your expected value; to find the margin of error, use the proportion you actually got in the survey (the sample proportion). Write it as a decimal from 0 to 1 (0.5 for 50%). |
| \(\varepsilon\) | epsilon | The margin of error, the gap you allow between the survey result and the true value. It is shown with ±, as in "±5%". |
| \(N\) | capital N | The population size, the number of people or items in the whole group you want to study (example - all 500 employees). |
Terms
| population | The whole group you really want to know about, such as "every voter in the country" or "all 500 employees". |
| sample | The part of the population that you pick out to actually study. The number of people or items in the sample is called the sample size. |
| random sampling | Choosing the sample so that everyone in the population has the same chance of being picked, like drawing names from a hat. The formulas on this page assume random sampling and do not work for surveys where only the people who want to answer do. |
| population proportion | The proportion you really want to know, such as the share of "yes" in the whole population. The proportion you get from a sample is called the sample proportion to tell them apart. |
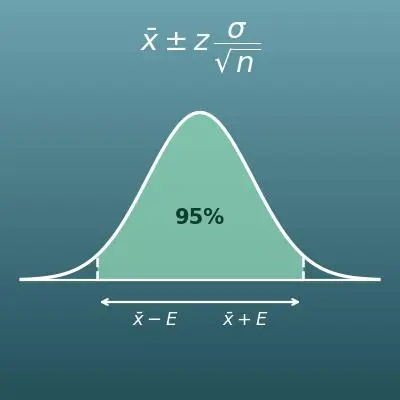
| confidence level | How certain you can be: if you repeated the same survey many times, the percentage of times the result would land within the margin of error. 95% is used most often. |
| confidence interval | The range you get when you show a survey result with some width, as in "52% ± 3% (49% to 55%)". The margin of error ±ε on this page is that width. |
| margin of error | The gap you allow between the survey result and the true value. It is what news polls mean by "a margin of error of ±3 points". |
| finite population correction | A correction that lowers the required sample size or the margin of error when you know the population has a limited size. It reflects the fact that the more of the population you study, the more certain the result. |
Good to know before you start
Here is what helps you use the calculation on this page with real understanding, not just by pressing the button.
| Percents and ratios (Grade 6) |
|
| Square roots (Grade 8) |
|
| Random sampling (Grade 7) |
|
| The normal distribution and statistical inference (high school statistics / AP Statistics) |
|
How to calculate it in Excel
| z-score (1.96 for 95%) | 1.96 |
| Expected proportion (%) | 50 |
| Margin of error (%) | 5 |
| Calculated value n0 | =B1^2*(B2/100)*(1-B2/100)/(B3/100)^2 |
| Required sample size (rounded up) | =ROUNDUP(B4,0) |
| z-score (1.96 for 95%) | 1.96 |
| Expected proportion (%) | 50 |
| Margin of error (%) | 5 |
| Population size N | 500 |
| Value before correction n0 | =B1^2*(B2/100)*(1-B2/100)/(B3/100)^2 |
| Required sample size (corrected, rounded up) | =ROUNDUP(B5/(1+(B5-1)/B4),0) |
| z-score (1.96 for 95%) | 1.96 |
| Proportion from the survey (%) | 60 |
| Sample size n | 100 |
| Margin of error (%) | =B1*SQRT(B2/100*(1-B2/100)/B3)*100 |
| z-score (1.96 for 95%) | 1.96 |
| Proportion from the survey (%) | 30 |
| Sample size n | 200 |
| Population size N | 1000 |
| Margin of error before correction (%) | =B1*SQRT(B2/100*(1-B2/100)/B3)*100 |
| Corrected margin of error (%) | =B5*SQRT((B4-B3)/(B4-1)) |
In the first table, B4 shows 384.16 and B5 shows 385. The answer in the second table is 218, in the third about 9.60 (%), and in the fourth about 5.68 (%).
"^" is a power (squared), "SQRT" is the square root, and "ROUNDUP" is the function for rounding up.
Note that the calculator on this page adds one more for safety even when the calculated value is exactly a whole number, so for such round values it can differ from Excel's ROUNDUP by 1.
How to calculate it in Google Sheets
| z-score (1.96 for 95%) | 1.96 |
| Expected proportion (%) | 50 |
| Margin of error (%) | 5 |
| Calculated value n0 | =B1^2*(B2/100)*(1-B2/100)/(B3/100)^2 |
| Required sample size (rounded up) | =ROUNDUP(B4,0) |
| z-score (1.96 for 95%) | 1.96 |
| Expected proportion (%) | 50 |
| Margin of error (%) | 5 |
| Population size N | 500 |
| Value before correction n0 | =B1^2*(B2/100)*(1-B2/100)/(B3/100)^2 |
| Required sample size (corrected, rounded up) | =ROUNDUP(B5/(1+(B5-1)/B4),0) |
| z-score (1.96 for 95%) | 1.96 |
| Proportion from the survey (%) | 60 |
| Sample size n | 100 |
| Margin of error (%) | =B1*SQRT(B2/100*(1-B2/100)/B3)*100 |
| z-score (1.96 for 95%) | 1.96 |
| Proportion from the survey (%) | 30 |
| Sample size n | 200 |
| Population size N | 1000 |
| Margin of error before correction (%) | =B1*SQRT(B2/100*(1-B2/100)/B3)*100 |
| Corrected margin of error (%) | =B5*SQRT((B4-B3)/(B4-1)) |
How to calculate it in Python
import math

# Quick table from confidence level (%) to z-score (customary rounded values)
z_table = {80: 1.28, 85: 1.44, 90: 1.65, 95: 1.96, 98: 2.33, 99: 2.58}

# ---- Way 1: find the required sample size ----
confidence_level = 95    # confidence level (%)
population_ratio = 50    # expected proportion (%)
margin_of_error = 5      # margin of error (%)
population_size = None   # population size (None if unknown or very large)

z = z_table[confidence_level]
p = population_ratio / 100
e = margin_of_error / 100

raw_size = z ** 2 * p * (1 - p) / e ** 2   # value before correction
if population_size is not None:
    raw_size = raw_size / (1 + (raw_size - 1) / population_size)   # finite population correction
required_size = math.floor(raw_size) + 1   # smallest whole number above the calculated value (rounded up for safety)
print(f"Required sample size: {required_size}")

# ---- Way 2: find the margin of error ----
sample_size = 1000       # sample size actually surveyed
sample_ratio = 50 / 100  # proportion from the survey (0.5 for 50%)

error_ratio = z * math.sqrt(sample_ratio * (1 - sample_ratio) / sample_size)
print(f"Margin of error: ±{error_ratio * 100:.2f}%")
How to write it in LaTeX and other math languages (copy and paste)
n₀ = z² × p̂(1 − p̂) ÷ ε²
n_0 = \dfrac{z^2 \, \hat{p}(1-\hat{p})}{\varepsilon^2}
<math xmlns="http://www.w3.org/1998/Math/MathML" display="block">
<mrow>
<msub><mi>n</mi><mn>0</mn></msub>
<mo>=</mo>
<mfrac>
<mrow>
<msup><mi>z</mi><mn>2</mn></msup>
<mover accent="true"><mi>p</mi><mo>^</mo></mover>
<mo>(</mo><mn>1</mn><mo>−</mo><mover accent="true"><mi>p</mi><mo>^</mo></mover><mo>)</mo>
</mrow>
<msup><mi>ε</mi><mn>2</mn></msup>
</mfrac>
</mrow>
</math>
n_0 = (z^2 hat(p)(1 - hat(p)))/(epsilon^2)
z^2*p*(1 - p)/err^2
n0 := z^2*p*(1 - p)/err^2;
n0 = z^2*p*(1 - p)/err^2;
n_0 = (z^2 p̂(1 − p̂))/ε^2
n = n₀ ÷ (1 + (n₀ − 1) ÷ N)
n = \dfrac{n_0}{1 + \dfrac{n_0 - 1}{N}}
<math xmlns="http://www.w3.org/1998/Math/MathML" display="block">
<mrow>
<mi>n</mi>
<mo>=</mo>
<mfrac>
<msub><mi>n</mi><mn>0</mn></msub>
<mrow>
<mn>1</mn><mo>+</mo>
<mfrac>
<mrow><msub><mi>n</mi><mn>0</mn></msub><mo>−</mo><mn>1</mn></mrow>
<mi>N</mi>
</mfrac>
</mrow>
</mfrac>
</mrow>
</math>
n = n_0/(1 + (n_0 - 1)/N)
n0/(1 + (n0 - 1)/nPop)
n := n0/(1 + (n0 - 1)/N);
n = n0/(1 + (n0 - 1)/N);
n = n_0/(1 + (n_0 − 1)/N)
ε = z × √(p̂(1 − p̂) ÷ n)
\varepsilon = z \sqrt{\dfrac{\hat{p}(1-\hat{p})}{n}}
<math xmlns="http://www.w3.org/1998/Math/MathML" display="block">
<mrow>
<mi>ε</mi>
<mo>=</mo>
<mi>z</mi>
<msqrt>
<mfrac>
<mrow>
<mover accent="true"><mi>p</mi><mo>^</mo></mover>
<mo>(</mo><mn>1</mn><mo>−</mo><mover accent="true"><mi>p</mi><mo>^</mo></mover><mo>)</mo>
</mrow>
<mi>n</mi>
</mfrac>
</msqrt>
</mrow>
</math>
epsilon = z sqrt((hat(p)(1 - hat(p)))/n)
z*Sqrt[p*(1 - p)/n]
err := z*sqrt(p*(1 - p)/n);
err = z*sqrt(p*(1 - p)/n);
ε = z√((p̂(1 − p̂))/n)
ε = ε₀ × √((N − n) ÷ (N − 1))
\varepsilon = \varepsilon_0 \sqrt{\dfrac{N-n}{N-1}}
<math xmlns="http://www.w3.org/1998/Math/MathML" display="block">
<mrow>
<mi>ε</mi>
<mo>=</mo>
<msub><mi>ε</mi><mn>0</mn></msub>
<msqrt>
<mfrac>
<mrow><mi>N</mi><mo>−</mo><mi>n</mi></mrow>
<mrow><mi>N</mi><mo>−</mo><mn>1</mn></mrow>
</mfrac>
</msqrt>
</mrow>
</math>
epsilon = epsilon_0 sqrt((N - n)/(N - 1))
err0*Sqrt[(nPop - n)/(nPop - 1)]
err := err0*sqrt((N - n)/(N - 1));
err = err0*sqrt((N - n)/(N - 1));
ε = ε_0 √((N − n)/(N − 1))
How to have ChatGPT do the calculation
You are a calculation assistant for statistical surveys. Do the following calculation by actually running Python code, and base your answer only on the numbers from the execution result (do not answer by mental math or guessing).

A service with 1,000 members is running a satisfaction survey. Use a 95% confidence level (z-score 1.96), an expected proportion of 50%, and a margin of error of ±5%.
Find each of the following:
1. The required sample size when the population is treated as very large (the calculated value and the number of people after rounding up)
2. The required sample size with the finite population correction for a population of 1,000
3. The margin of error (with the finite population correction, in %) if only 200 people respond

Show the formulas you used and the numbers from the execution result.
How to Use
-
1Enter your numbersType the numbers you want to calculate with into the input fields
-
2CalculatePress the "Calculate" button
-
3Check the resultThe result appears on the spot. The same page also explains the idea behind the calculation and the formula
DataChef Features

No technical knowledge required.
Intuitive and user-friendly operation.

Can be used without registering personal information.

Automatic file deletion by clicking "download".

and rapid file conversion.

No attribution required.

No need to contact us for commercial use permission.
Related Features
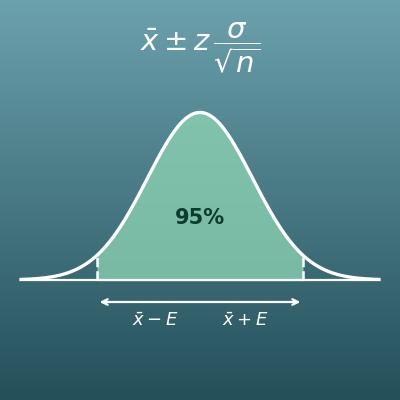
Confidence Interval Calculator for a Population Mean
Find a confidence interval (such as a 95% confidence interval) for a mean
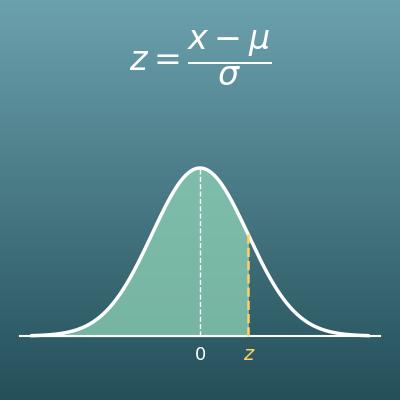
Z-Score Calculator: Z-Score to Probability and Back
Find the z-score from a value, mean and standard deviation, and convert it to a probability and back
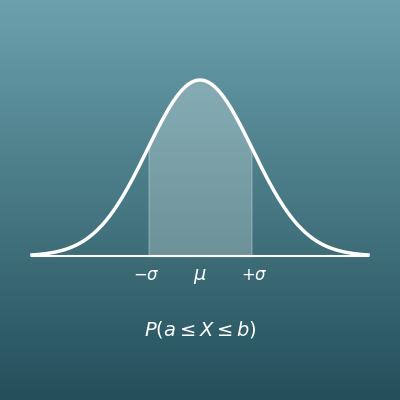
Normal Distribution Probability Calculator
From the mean and standard deviation, find the probability of falling in a given range
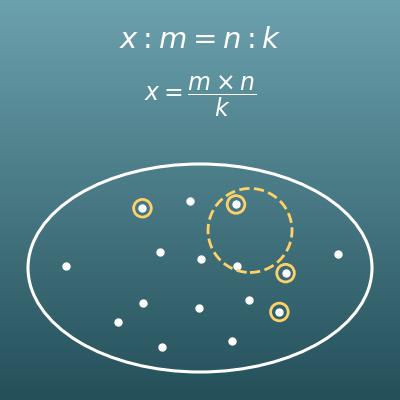
Population Estimate Calculator (Mark and Recapture, Random Samples)
Estimate the population from the results of a sample you took, the middle-school way (this page is the survey design side, the number you need). It also covers capture-recapture for fish in a pond